- Oil is under pressure since it spiked up in mid-September.
- The level to beat for bears is $54.00 a barrel.
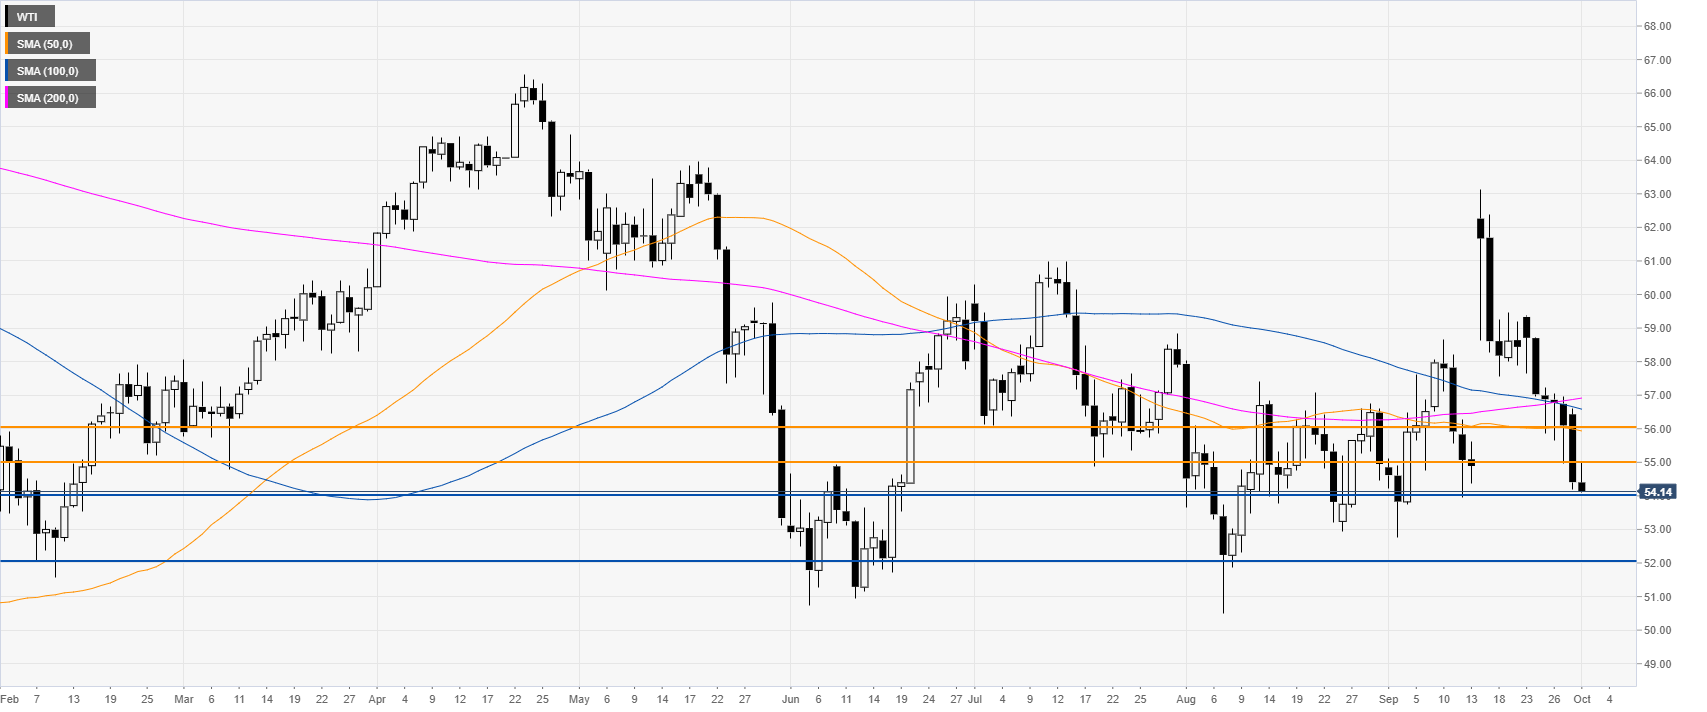
Oil daily chart
WTI (West Texas Intermediate) is trading in a bear trend below its main daily simple moving averages (SMAs).
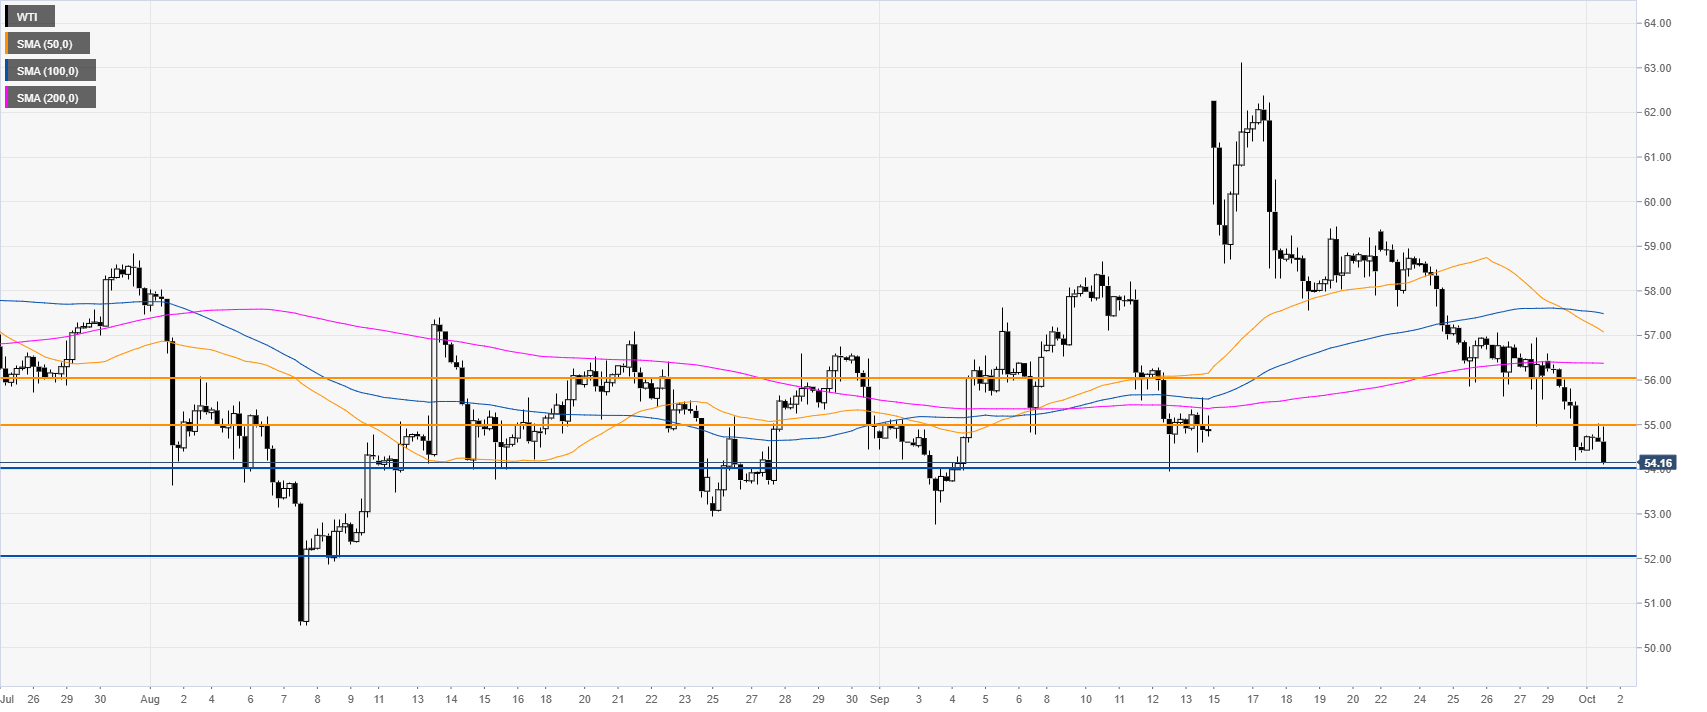
Four-hour chart
The market is challenging $54.00 a barrel while trading below its main SMAs. All-in-all suggesting bearish momentum in the medium term. A break of 54.00 support can lead to a drop to the 52.00 level. Resistance is seen at the 55.00 and 56.00 level.
Additional key levels
