- OMG Network price is undergoing a temporary correction that could retest the $8 level.
- The MRI warns of an incoming cycle top suggesting a pullback around the corner.
- On-chain metrics show increased adoption and whale activity that justifies a bounce after 12% retracement.
The OMG Network price faces the threat of a reversal that could set the stage for enormous gains in the near future.
OMG Network price begins correction
The OMG Network price created two higher lows that formed a series of highs around the supply barrier at $7.97. If the swing points are joined using trend lines, an ascending triangle pattern evolves.
The technical formation is inherently bullish and projects a 52% upswing to $12.2, determined by adding the pivot high and low distance to the breakout point at $7.97.
On April 4, OMG broke out of the setup as it surged 40%. However, this uptrend halted as it faced a local top at $11.37. Since then, the OMG Network price has dropped nearly 20% and shows signs of continuing this downtrend.
The primary reason for such bearishness is the preemptive cycle top signal flashed by the Momentum Reversal Indicator (MRI) in the form of a yellow candlestick on the 12-hour chart. A potential close above $8.7 will trigger a reliable cycle top signal, which forecasts a one-to-four candlestick correction.
In such a case, the ascending triangle’s base at $7.97 will serve as a stable demand barrier. Hence, investors need to keep a close eye on $8.7 and $7.97 levels since these levels are crucial in establishing a direction for the OMG price.
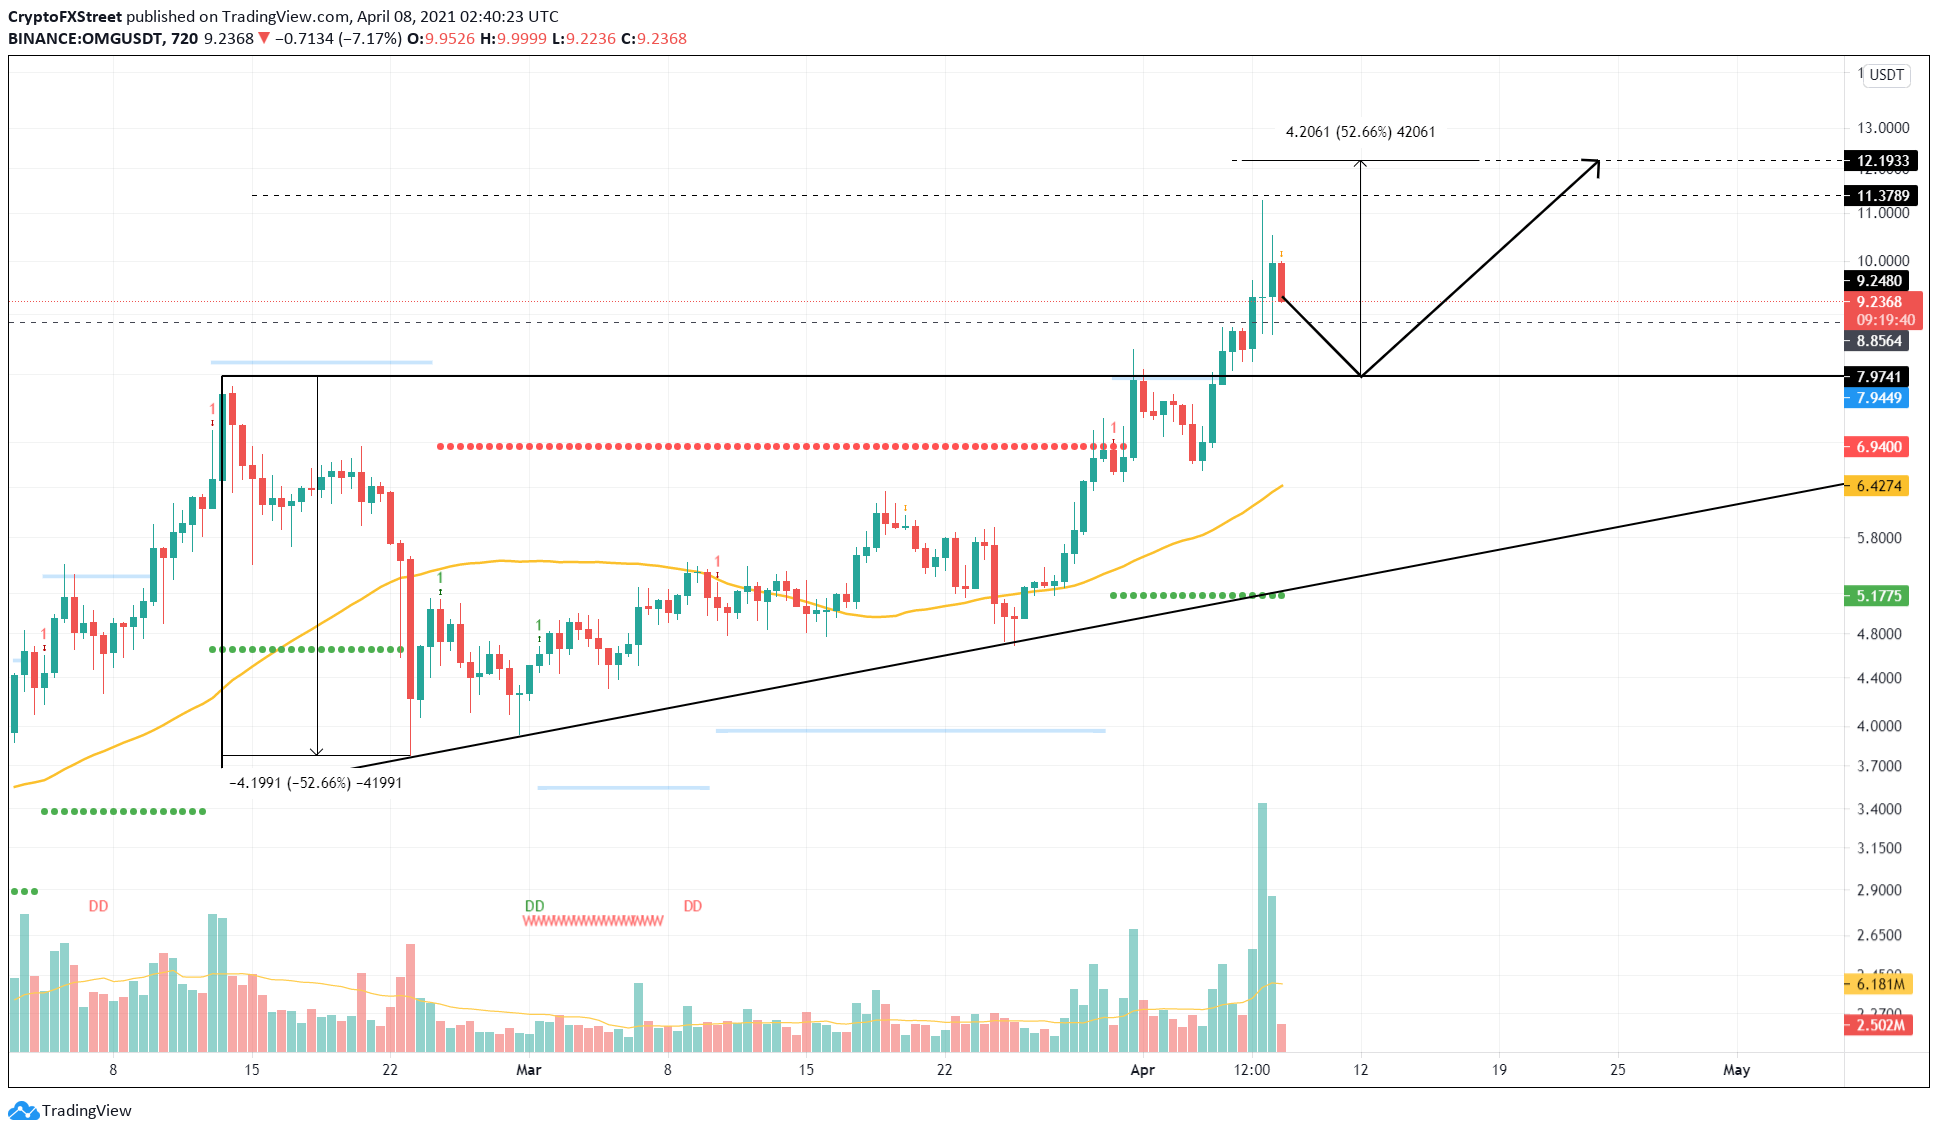
OMG/USDT 12-hour chart
Supporting the short-term retracement is Santiment’s 30-day MVRV model for the OMG Network price, which spiked to 30% and is on a pullback as well. This metric helps identify if the market participants are in profit or loss.
For OMG, 30% seems a reliable cycle top signal since investors have booked profit around this level, creating price tops several times.
%20%5B08.36.49,%2008%20Apr,%202021%5D-637534506888431226.png)
OMG MVRV 30-day chart
While the short-term picture does look bearish, the number of participants on the OMG Network seems to be rising while the whales go on an accumulation spree. Such a combination paints a bullish picture, suggesting that a bounce from the $7.97 level seems likely.
Based on IntoTheBlock’s In/Out of the Money Around Price (IOMAP) model, the demand barriers are stacked up to $7.98. Hence, a retracement beyond this level seems unlikely.
Further confirming the 52% uptrend is the lack of resistance levels up to $10.60, where roughly 68,000 addresses that previously purchased 4.36 million OMG tokens are “Out of the Money.”
During the reversal, the OMG Network price needs to surge past these levels to signify the buyers’ strength.
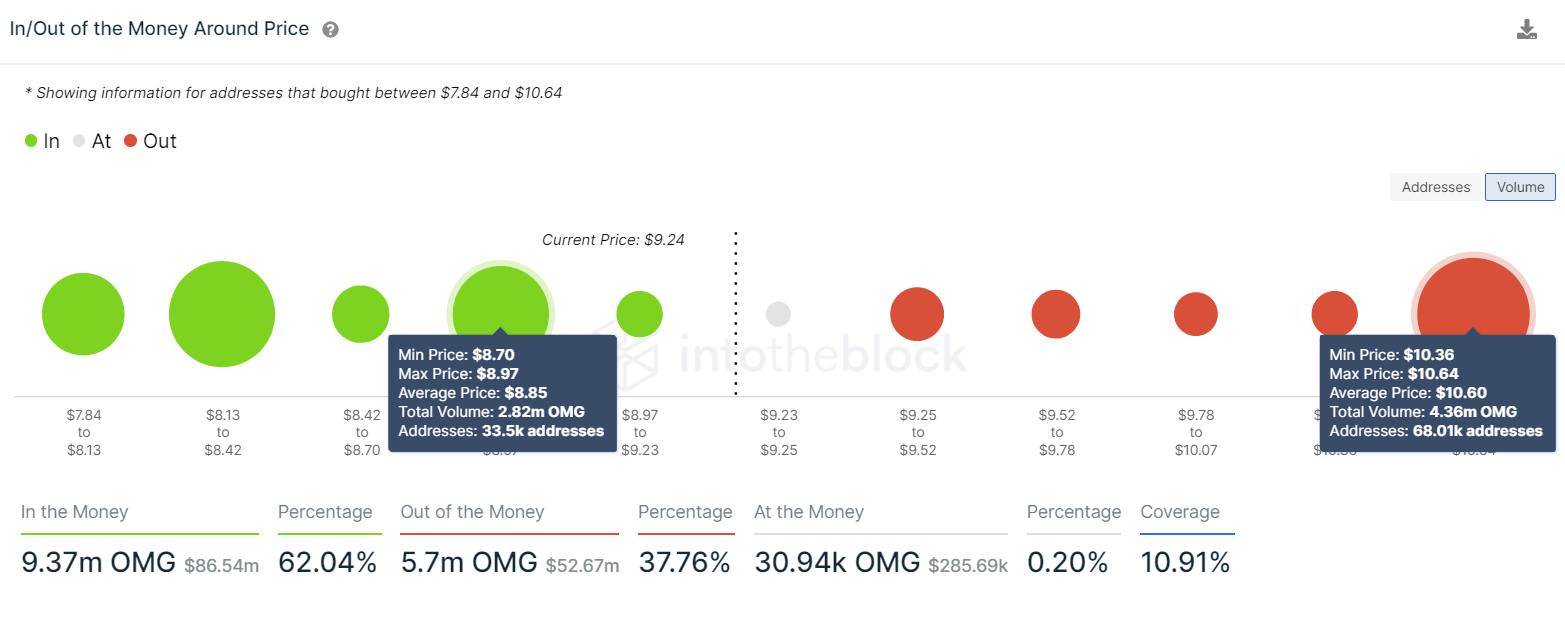
OMG IOMAP chart
New addresses joining the OMG Network have increased by 100% over the last month. A total of 957 new market participants created new addresses, suggesting their interest in OMG at the current price levels.
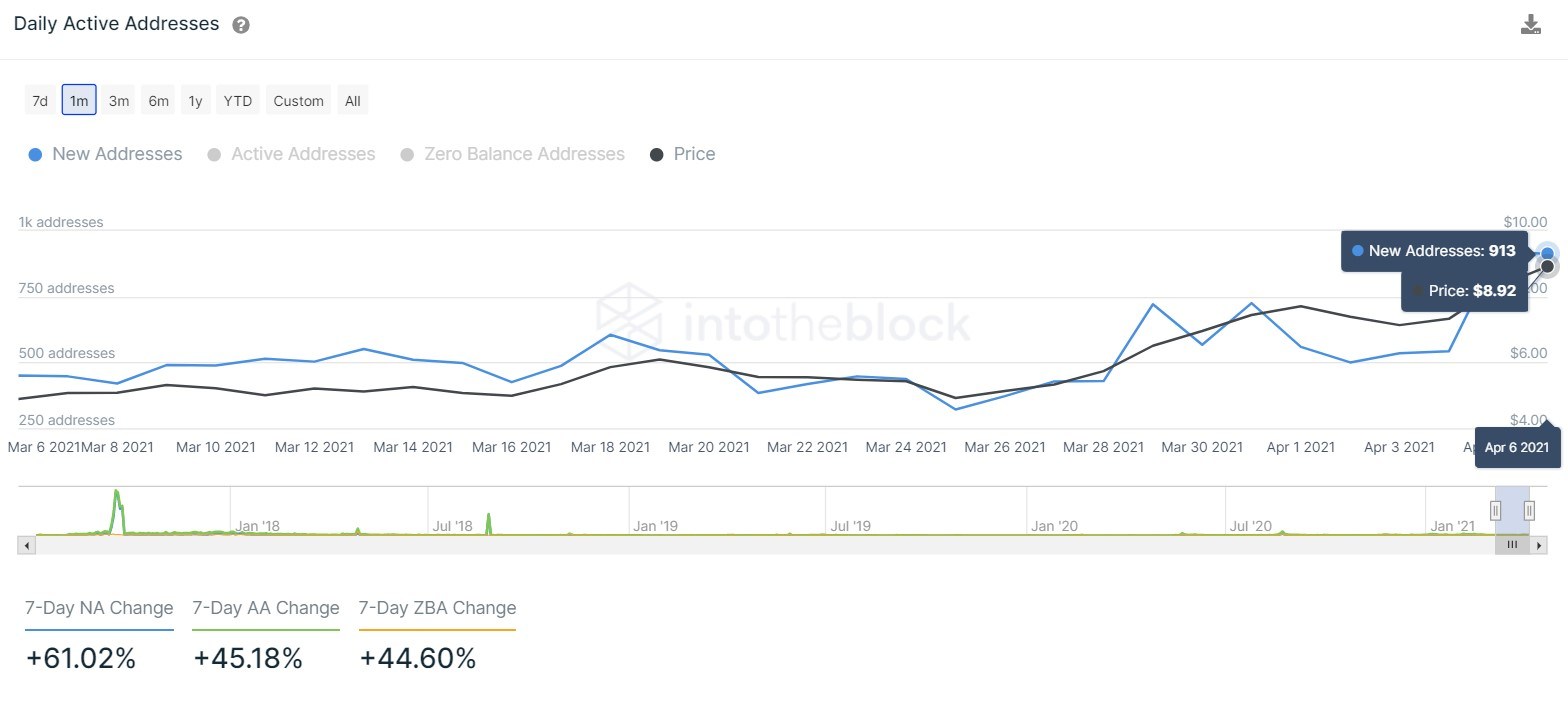
OMG new addresses chart
Similarly, transactions worth $100,000 or more have skyrocketed by 2,400% in the last month. This surge serves as a proxy to high net worth investors’ investment in OMG.
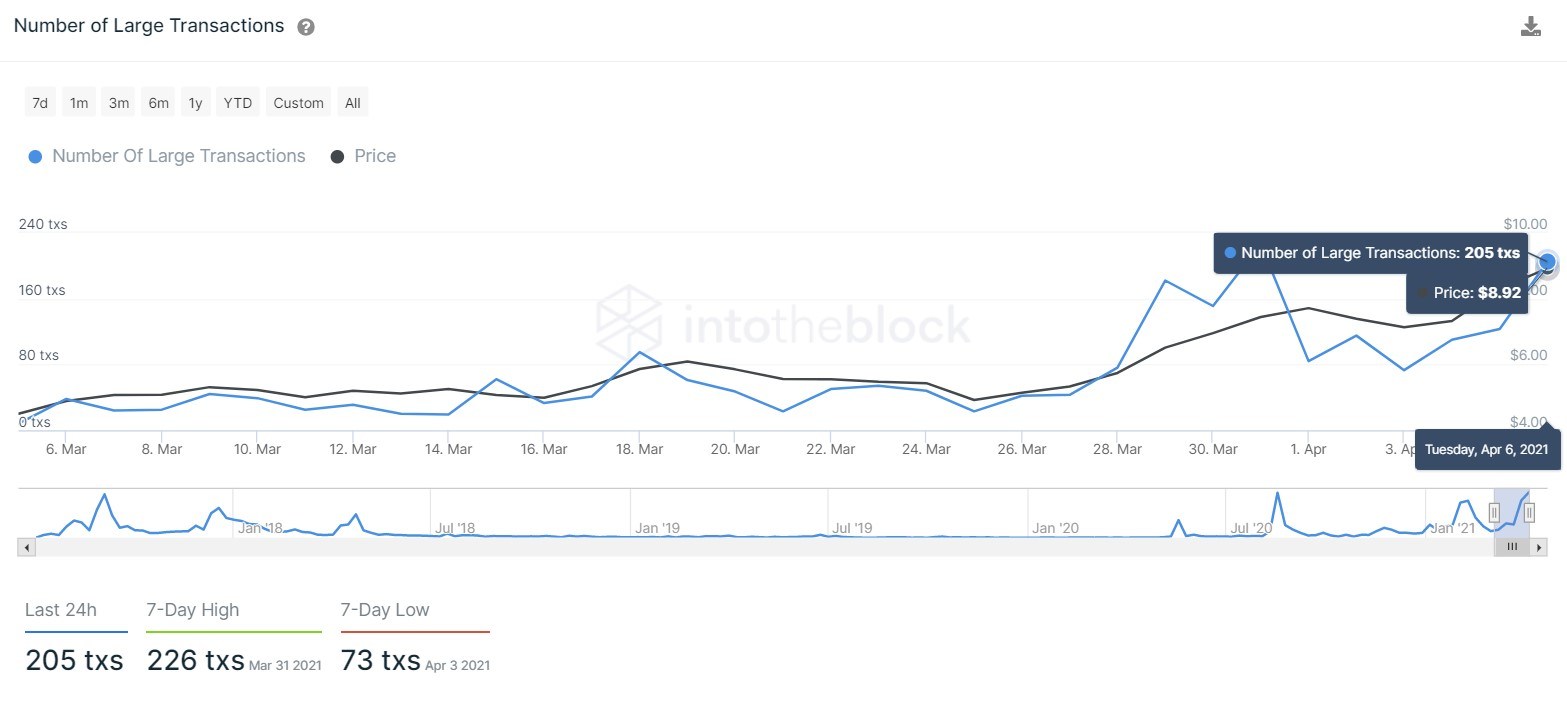
OMG large transaction count chart
The bullish narrative for the OMG Network price relies solely on a bounce around the demand barrier at $7.97. A decisive close below $6.83 will invalidate the bullish outlook.
In such a scenario, the OMG Network price could slide 4.5% to $6.51.
