- OMG price is contained inside an ascending triangle pattern on the 1-hour chart.
- The digital asset has defended a crucial support level and awaits a rebound towards $5.
- A breakout above the triangle pattern can easily push OMG price towards $5.6.
In the short-term, OMG price has topped out at around $5 establishing a significant resistance level around this point. However, bulls have just defended a critical support level at $4.8 and aim for a rebound towards $5 again.
OMG price aims for a rebound towards $5.6
On the 1-hour chart, OMG bulls held the significant support trendline at $4.8 and aim for a rebound to the upper trendline of the triangle pattern located at $5. A breakout of this critical resistance level would drive OMG price up to $5.6.
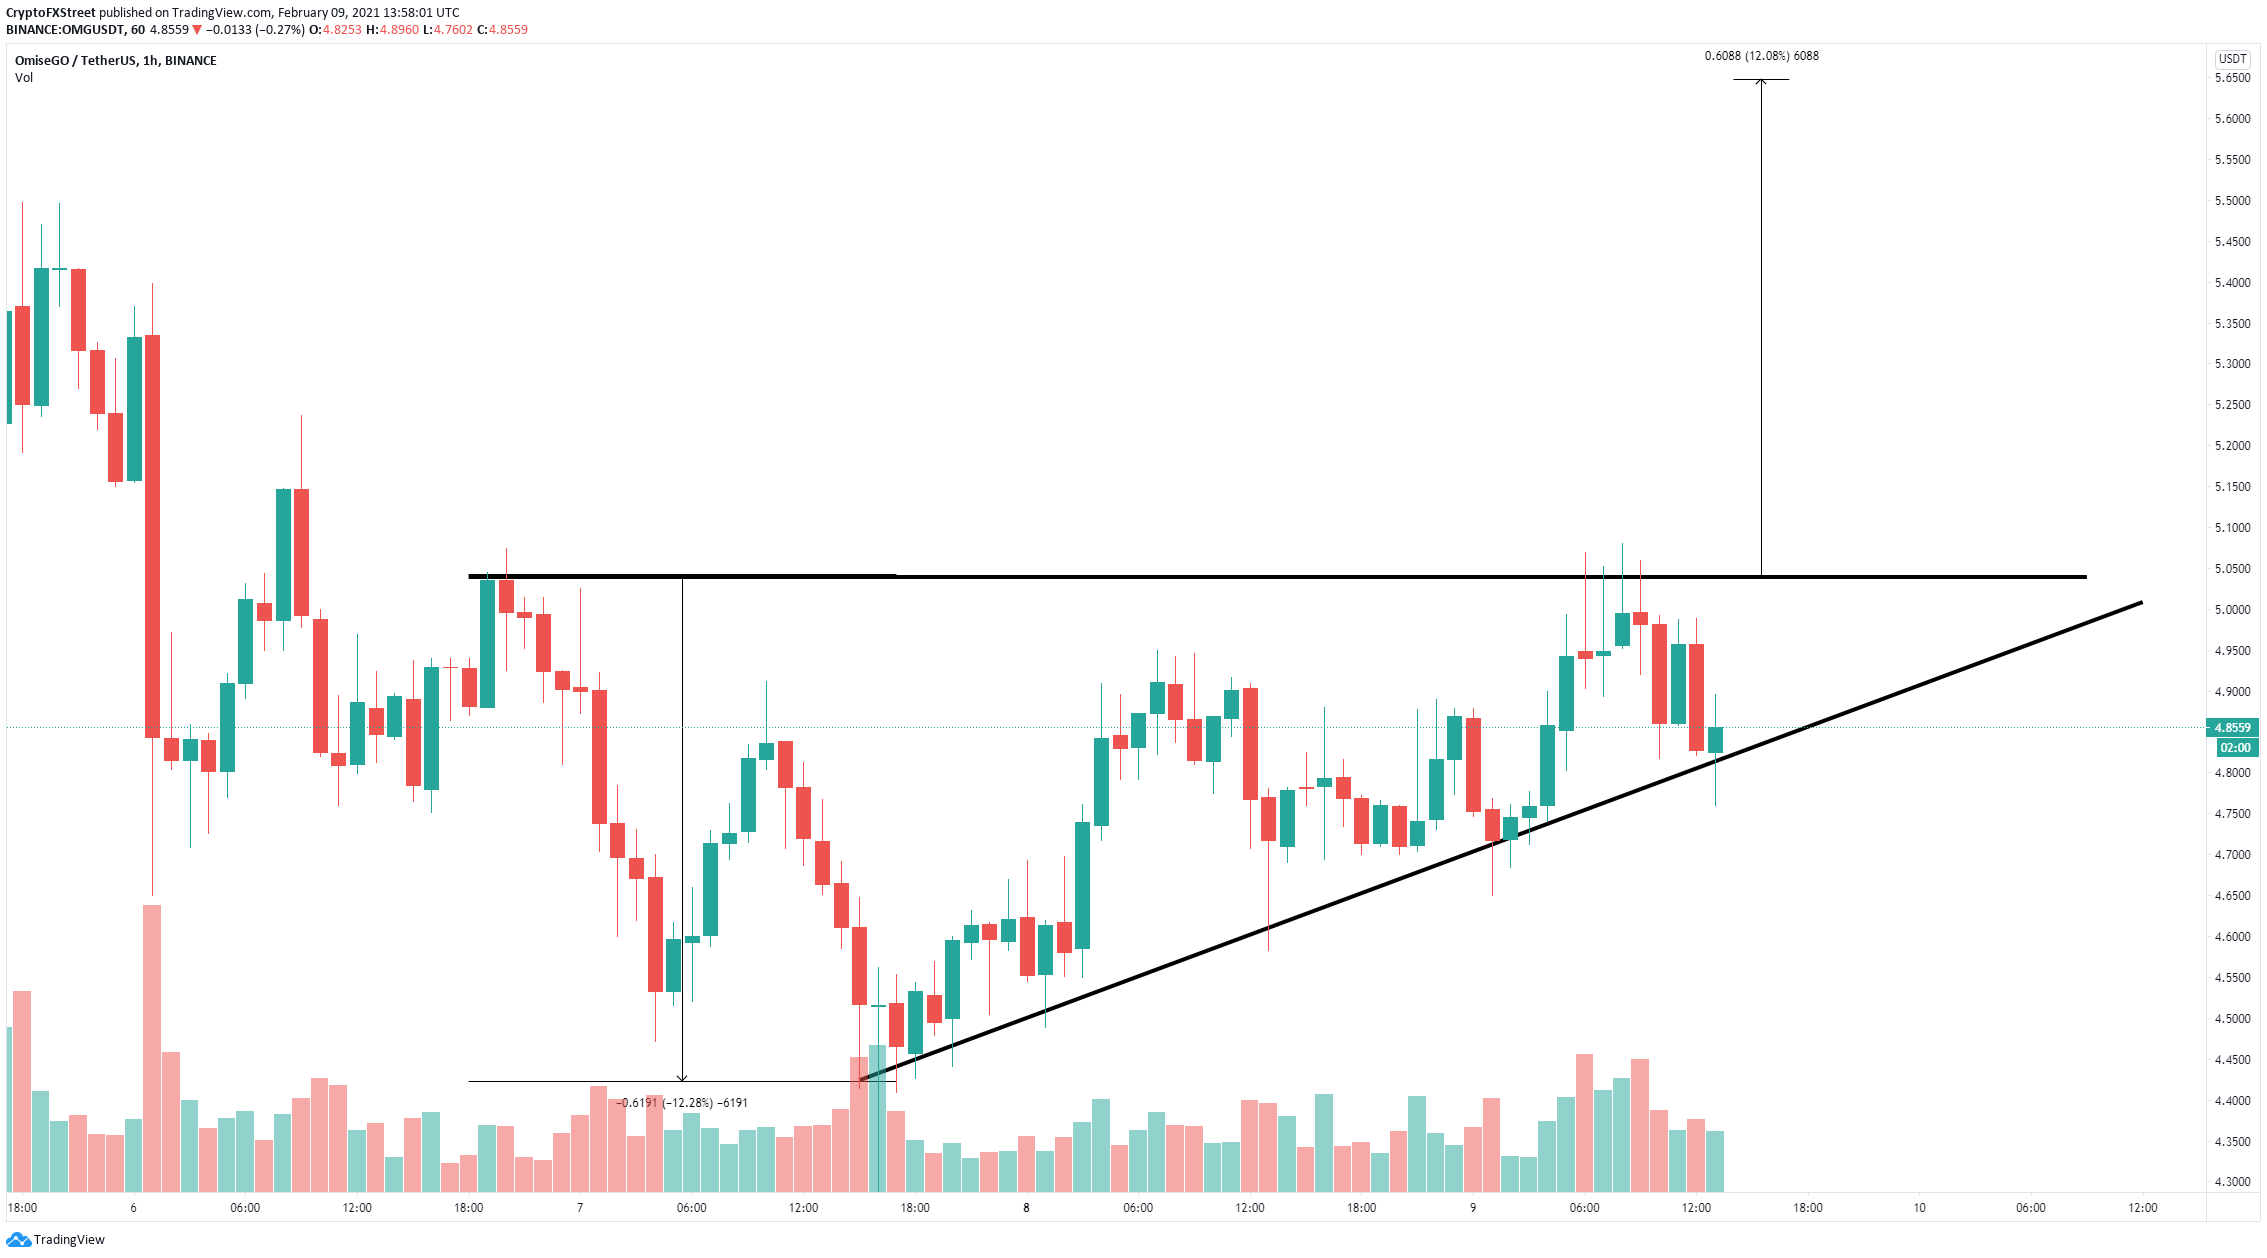
OMG/USD 1-hour chart
The In/Out of the Money Around Price (IOMAP) model shows only one significant resistance area between $4.87 and $5.02 where 896 addresses purchased around 2.17 million OMG. Cracking this level, which coincides with the upper trendline of the pattern above, will drive OMG price towards $5.6 as there are no other barriers ahead.
-637484797774982720.png)
OMG IOMAP chart
However, although the IOMAP chart does indicate that OMG has a lot of support below $4.8, losing this level would be a significantly bearish sign.
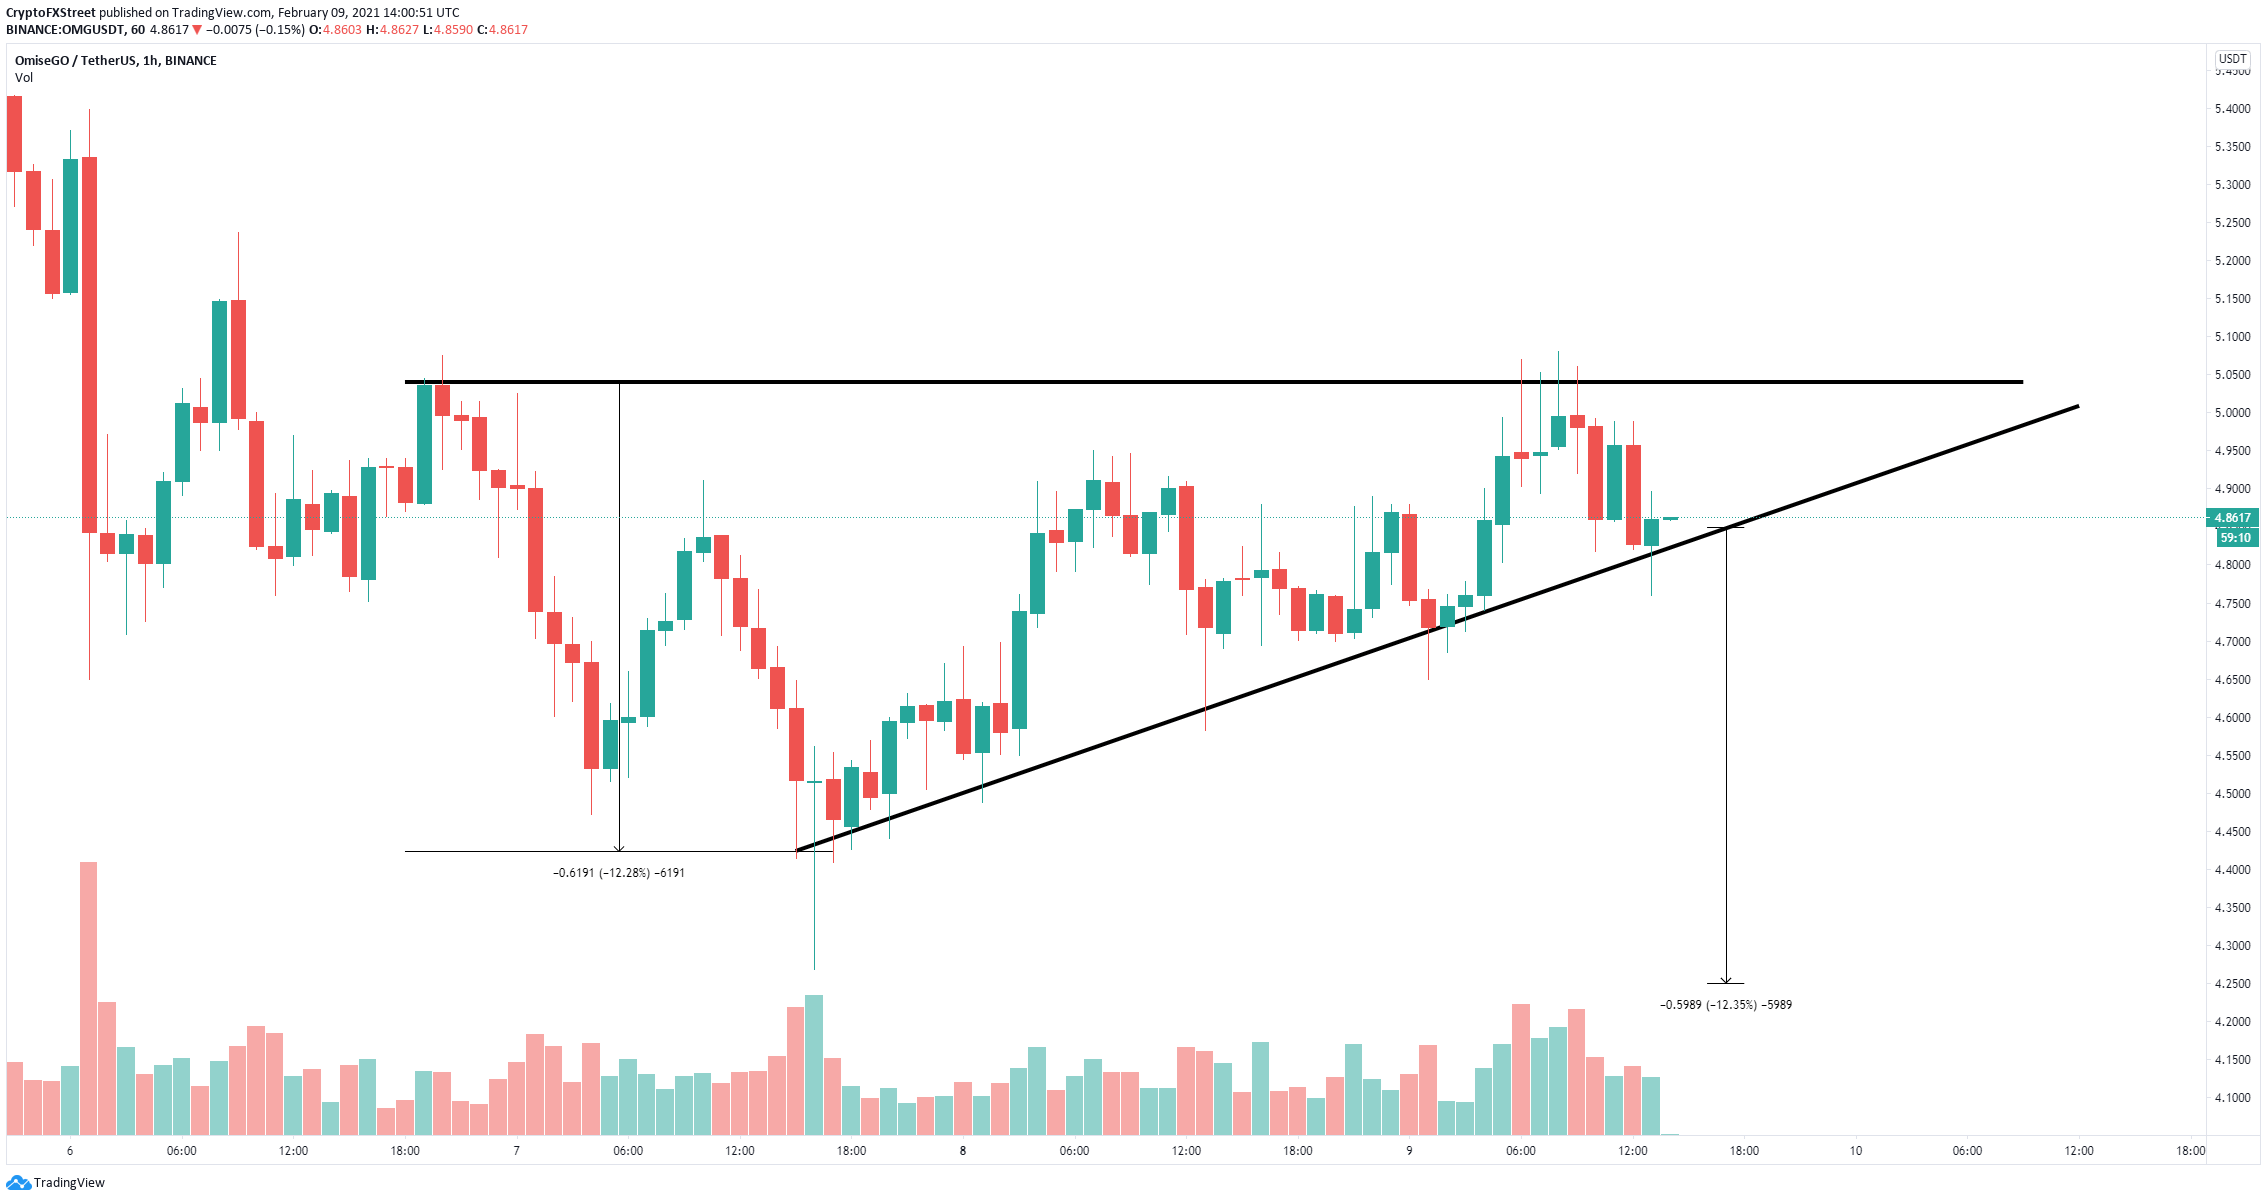
OMG/USD 1-hour chart
The loss of $4.8 represents a breakdown from the ascending triangle pattern on the 1-hour chart. Using the height of the pattern as a reference point, we can determine the bearish price target to be located at $4.25.
