- The total market capitalization of cryptos fell by more than $70 billion in the last week after a notable crash.
- Most major cryptocurrencies are now trading sideways trying to bounce back up.
The cryptocurrency market is usually extremely volatile and predicting the bottom can be an arduous task. One of the most recent reports from Santiment, a cryptocurrency analysis platform, talks about the crypto market bottom.
In the article, the author uses two on-chain metrics, the age consumed, and daily active deposits. These two metrics can show which coins have investors with ‘weak hands’ and ‘strong hands’. According to the author, KNC, ZRX, OMG, and YFI are coins with weak hands while LINK, MKR, LEND and PIE, have strong hands. The conclusion is that not all investors panicked which means the bottom is not really in. Of course, this article is not a deep-dive report but still shows the bottom might not be in just yet.
BTC/USD weekly chart
-637352673443035895.png)
It’s always helpful to look at the bigger picture to understand if a bottom might be close to forming or not. Bitcoin is clearly showing a lot of strength around $10,000 which was previously a crucial resistance level, however, the CME gap at $9,665 makes it difficult for $10k to be called the bottom.
The 26-EMA at $9,749 has been acting as a strong support level as well but it’s also higher than the CME gap. Historically, all gaps have been filled eventually which means the bottom for Bitcoin should be $9,665 or below. If we break that level, bulls will find support at $9,106 from the 50-MA and of course $9,000 which is another psychological level of support.
If we take a look at the last two big bottoms at $3,156 in December 2018 and $3,782 in March 2020, the RSI got overextended on both occasions. Each time this momentum indicator dropped below 30, Bitcoin bounced significantly afterwards. But what about other bottoms?
During the rally in 2020 after the crash of March, the RSI didn’t drop below 52 which seems to be a strong support level. Interestingly, the RSI is currently right above this level which could indicate that a short-term bottom might be in already.
XRP/USD weekly chart
-637352673066761105.png)
XRP is fundamentally different from BTC or ETH. It’s also weaker and has been in a massive weekly downtrend for a longer period. When looking at this cryptocurrency’s weekly chart, we can see that it hasn’t even formed a bottom yet as it has continued posting lower lows and lower highs since the peak of early 2018.
What appears to be bottom was formed in March of this year, when the RSI nearly tested the 30 level.
XRP/USD daily chart
-637352672449221520.png)
While the RSI on XRP’s weekly chart is not close to overextension, on the daily chart it paints a different picture. Within this time frame, the cross-border remittances token is on the verge of reaching oversold territory.
The last time this happened was in June 2020 when XRP set a short-term bottom straight into a bull rally. It also was overextended in March which is where the bottom seems to have formed on the weekly chart.
Considering the RSI is currently at around 39 on the daily chart, an overextension would be achieved if the bears can push XRP down to $0.22-0.21. Such a price point would be extremely close to the $0.20 psychological level. This area could be the next short-term bottom for XRP.
ETH/USD weekly chart
-637352672013544901.png)
Ethereum is also far different from BTC and XRP. The bulls have managed to hold $81.79, which was the bottom of December 2018. And a new bottom was formed at $86 in March 2020. However, the RSI was not quite overextended during the most recent crash .
ETH/USD daily chart
-637352671105768442.png)
Like Bitcoin, Ethereum was struggling to crack a massive resistance level at $250. After slicing through it, however, the smart contracts giant got close to $500 and it’s now trading at $348 after establishing a low at $308. Bitcoin on the other hand is right at $10,000, which was its most important resistance level before the breakout took place.
Clearly, $10,000 is now a huge support level for Bitcoin and we can assume $250 would do the same for Ethereum. The next support level is $300, but if bears were to crack this price hurdle, Ether could drop towards $250.
It’s important to note that the RSI is extremely close to oversold levels and hasn’t been in this position since March. Judging by the current levels at which the RSI is hovering at, anything below $300 would push this indicator to oversold conditions, which means the area between $300 and $250 might be the next bottom for ETH.
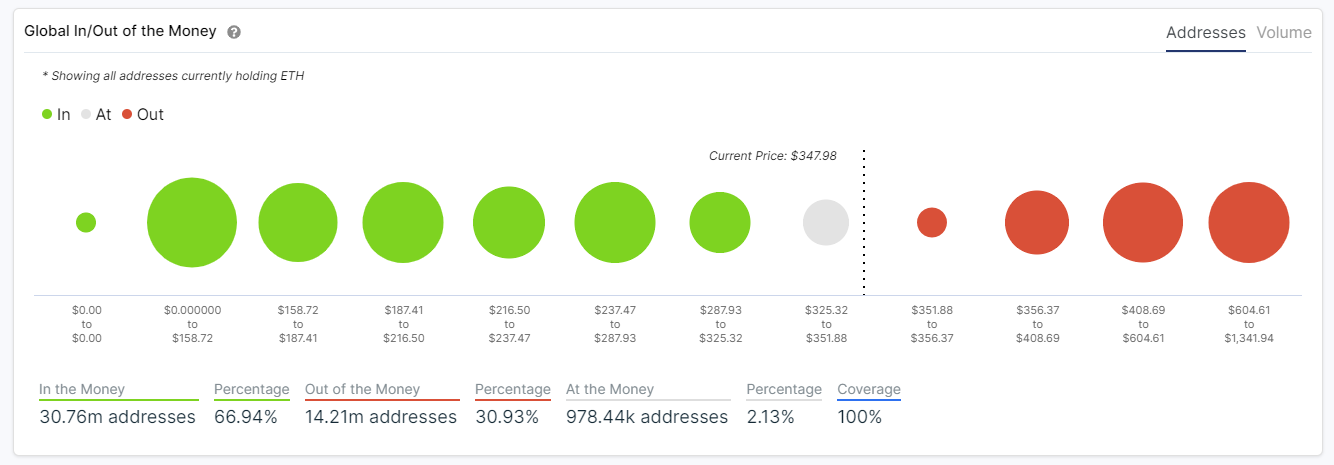
This can be further supported using the IOMAP chart which shows a large concentration of addresses around $304 and $256 while very few at $353 and still relatively low at $387.
Conclusion
Determining the crypto bottom can be hard, but thanks to on-chain metrics and technical analysis we can estimate it quite well. It’s entirely possible for Bitcoin to fill its CME gap while Ethereum maintains $300 as the second-ranked cryptocurrency has been far stronger than Bitcoin. XRP, on the other hand, could drop even further due to its long-term weaknesses.
While some of the data shows the bottom is not in just yet, bulls are already buying the dip. Tether deposits to centralized exchange wallets have increased significantly to $130 million in the past few days, a 430% increase.
