- Palladium holds onto previous day’s recovery moves from key SMA, Fibonacci retracement level.
- Monthly horizontal hurdle, short-term falling trend line test the bulls.
- Easing bearish bias of MACD backs further upside, 61.8% Fibonacci retracement offers extra support.
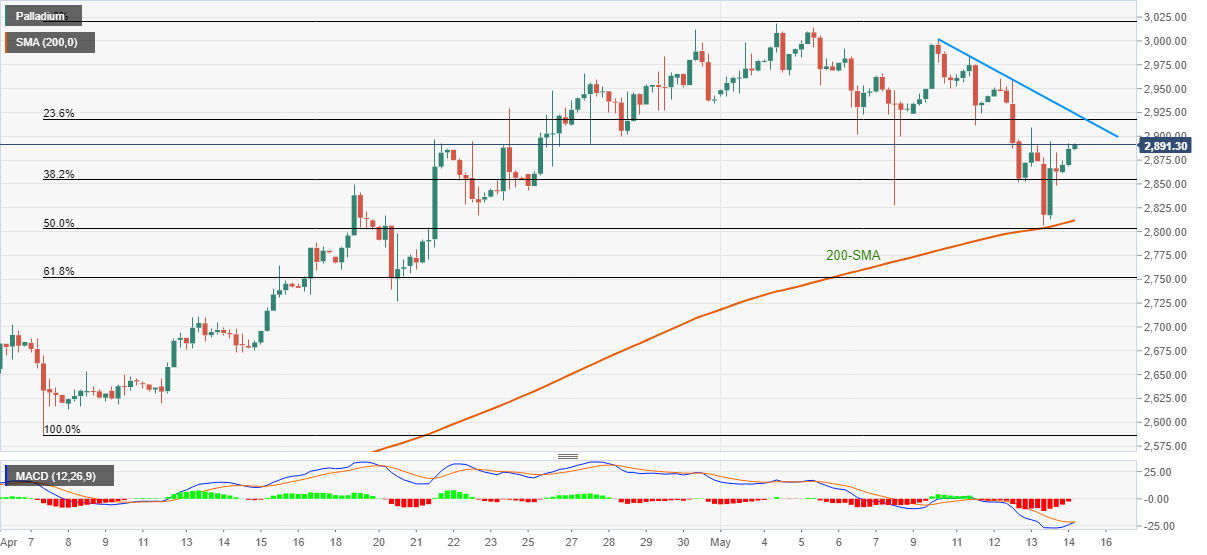
Palladium (XPD/USD) prices pick-up bids around $2,891, up 0.88% intraday, ahead of Friday’s European session. In doing so, the bullion justifies the previous day’s bounce off 200-SMA and 50% Fibonacci retracement level of April-May upside. Also backing the recovery movement is the receding bearish bias of the MACD.
Even so, multiple lows marked since late April around $2,900-901 guard the commodity’s immediate upside.
During the quote’s run-up beyond $2,901, a weekly falling trend line near $2,920-21 will be the key as it holds the gate for the pair’s run-up towards the all-time high of $3,020.
Meanwhile, 200-SMA and 50% Fibonacci retracement, respectively around $2,810 and $2,800 will direct the palladium sellers toward the 61.8% Fibonacci retracement level of $2,751.
It should, however, be noted that the bears will gain strength on the break of $2,751, which in turn could recall the $2,700 threshold back to the chart.
Palladium four-hour chart
Trend: Bullish
