- Polkadot price hit a new all-time high at $21.73 on February 4.
- The digital asset has a lot of bullish momentum behind it and aims for $24.
- Only one crucial resistance level separates Polkadot from a new all-time high.
Polkadot price continues surging higher as the digital asset reaches $19 billion in market capitalization, on the verge of passing XRP. Despite the massive bull rally, it seems that DOT can see a new all-time high as there is only one crucial barrier ahead.
Polkadot price aims for $24 if bulls can crack this resistance level
On the 4-hour chart, Polkadot price was trading inside an ascending parallel channel from which it broke out on February 3. The digital asset had a significant pullback to re-test the previous resistance level and has rebounded.
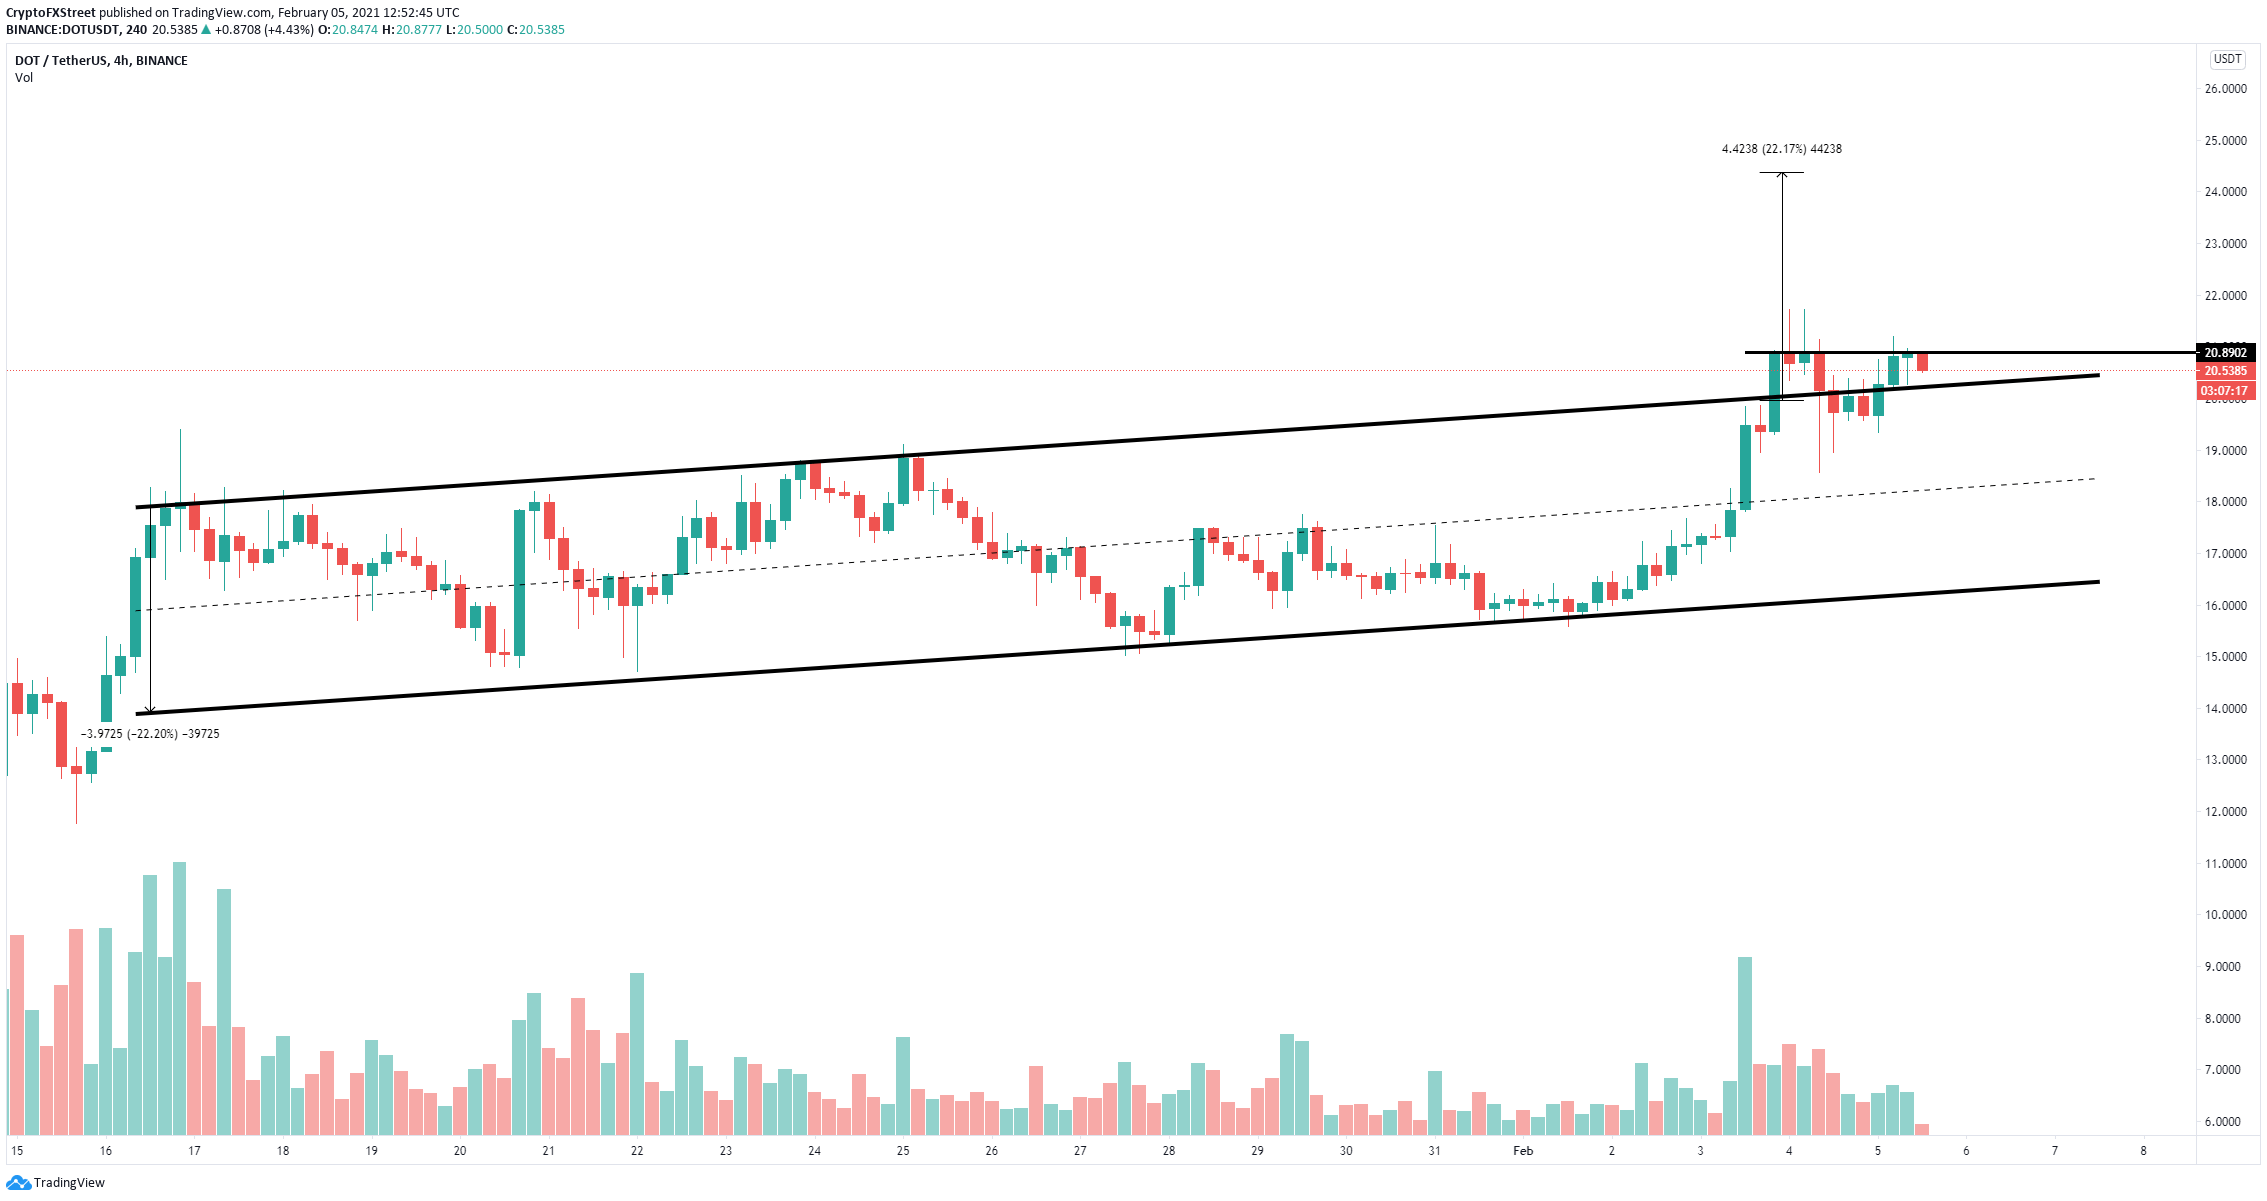
DOT/USD 4-hour chart
A critical resistance level has formed at $20.9 and has been tested several times in the past three days. A breakout above this point should drive Polkadot price towards the previous target of $24, which was calculated using the height of the parallel channel.
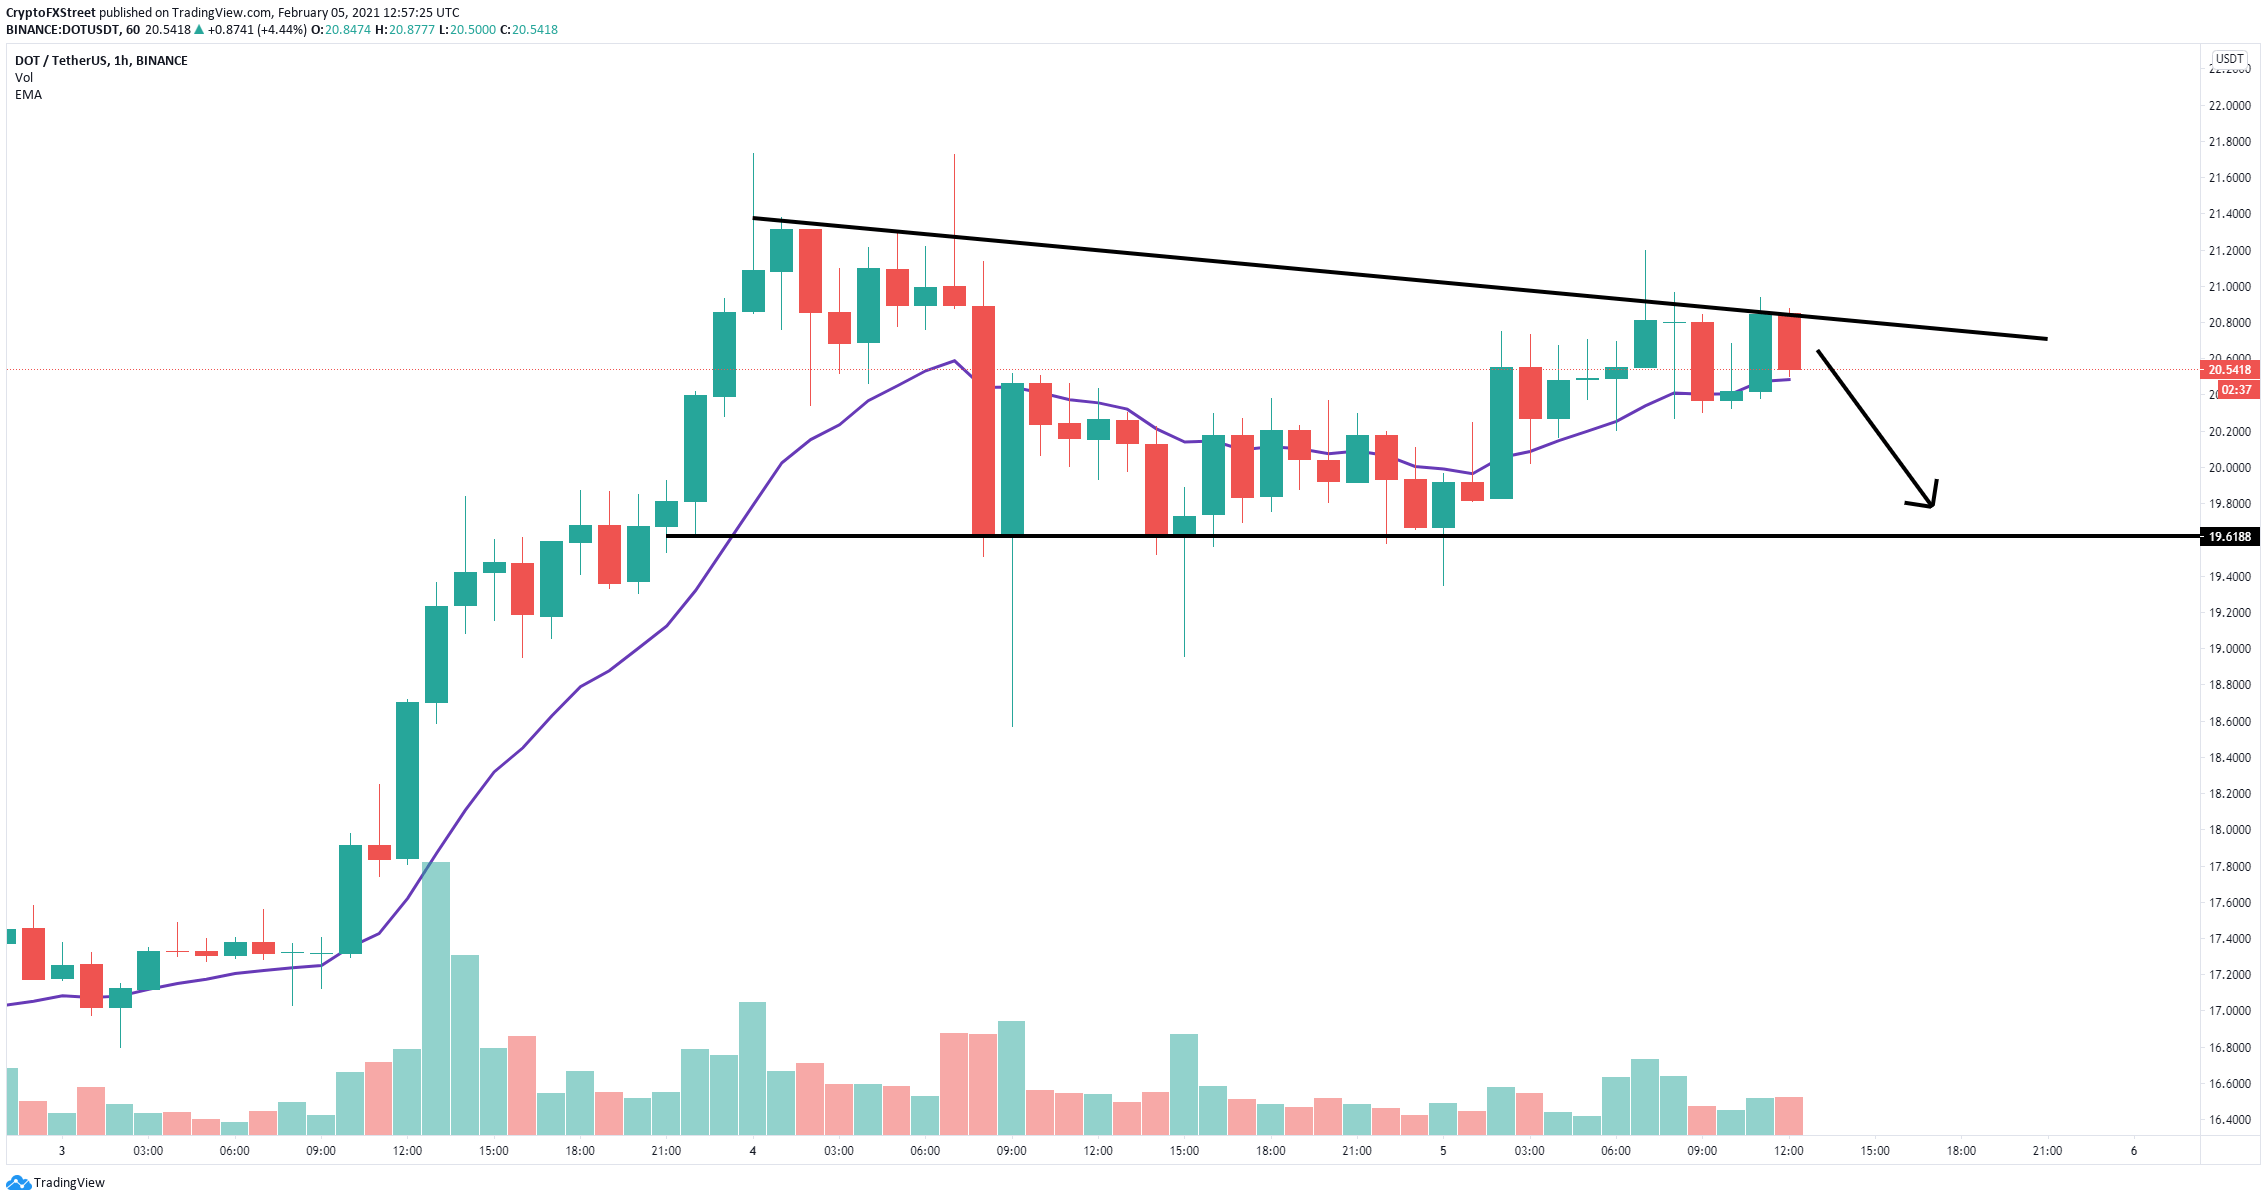
DOT/USD 1-hour chart
However, it seems that Polkadot price has been rejected from $20.9 and it’s on the verge of losing the 26-EMA on the 1-hour chart. If this level breaks, DOT can fall towards $19.6, which is the lower trendline of a descending triangle pattern formed on this chart.
