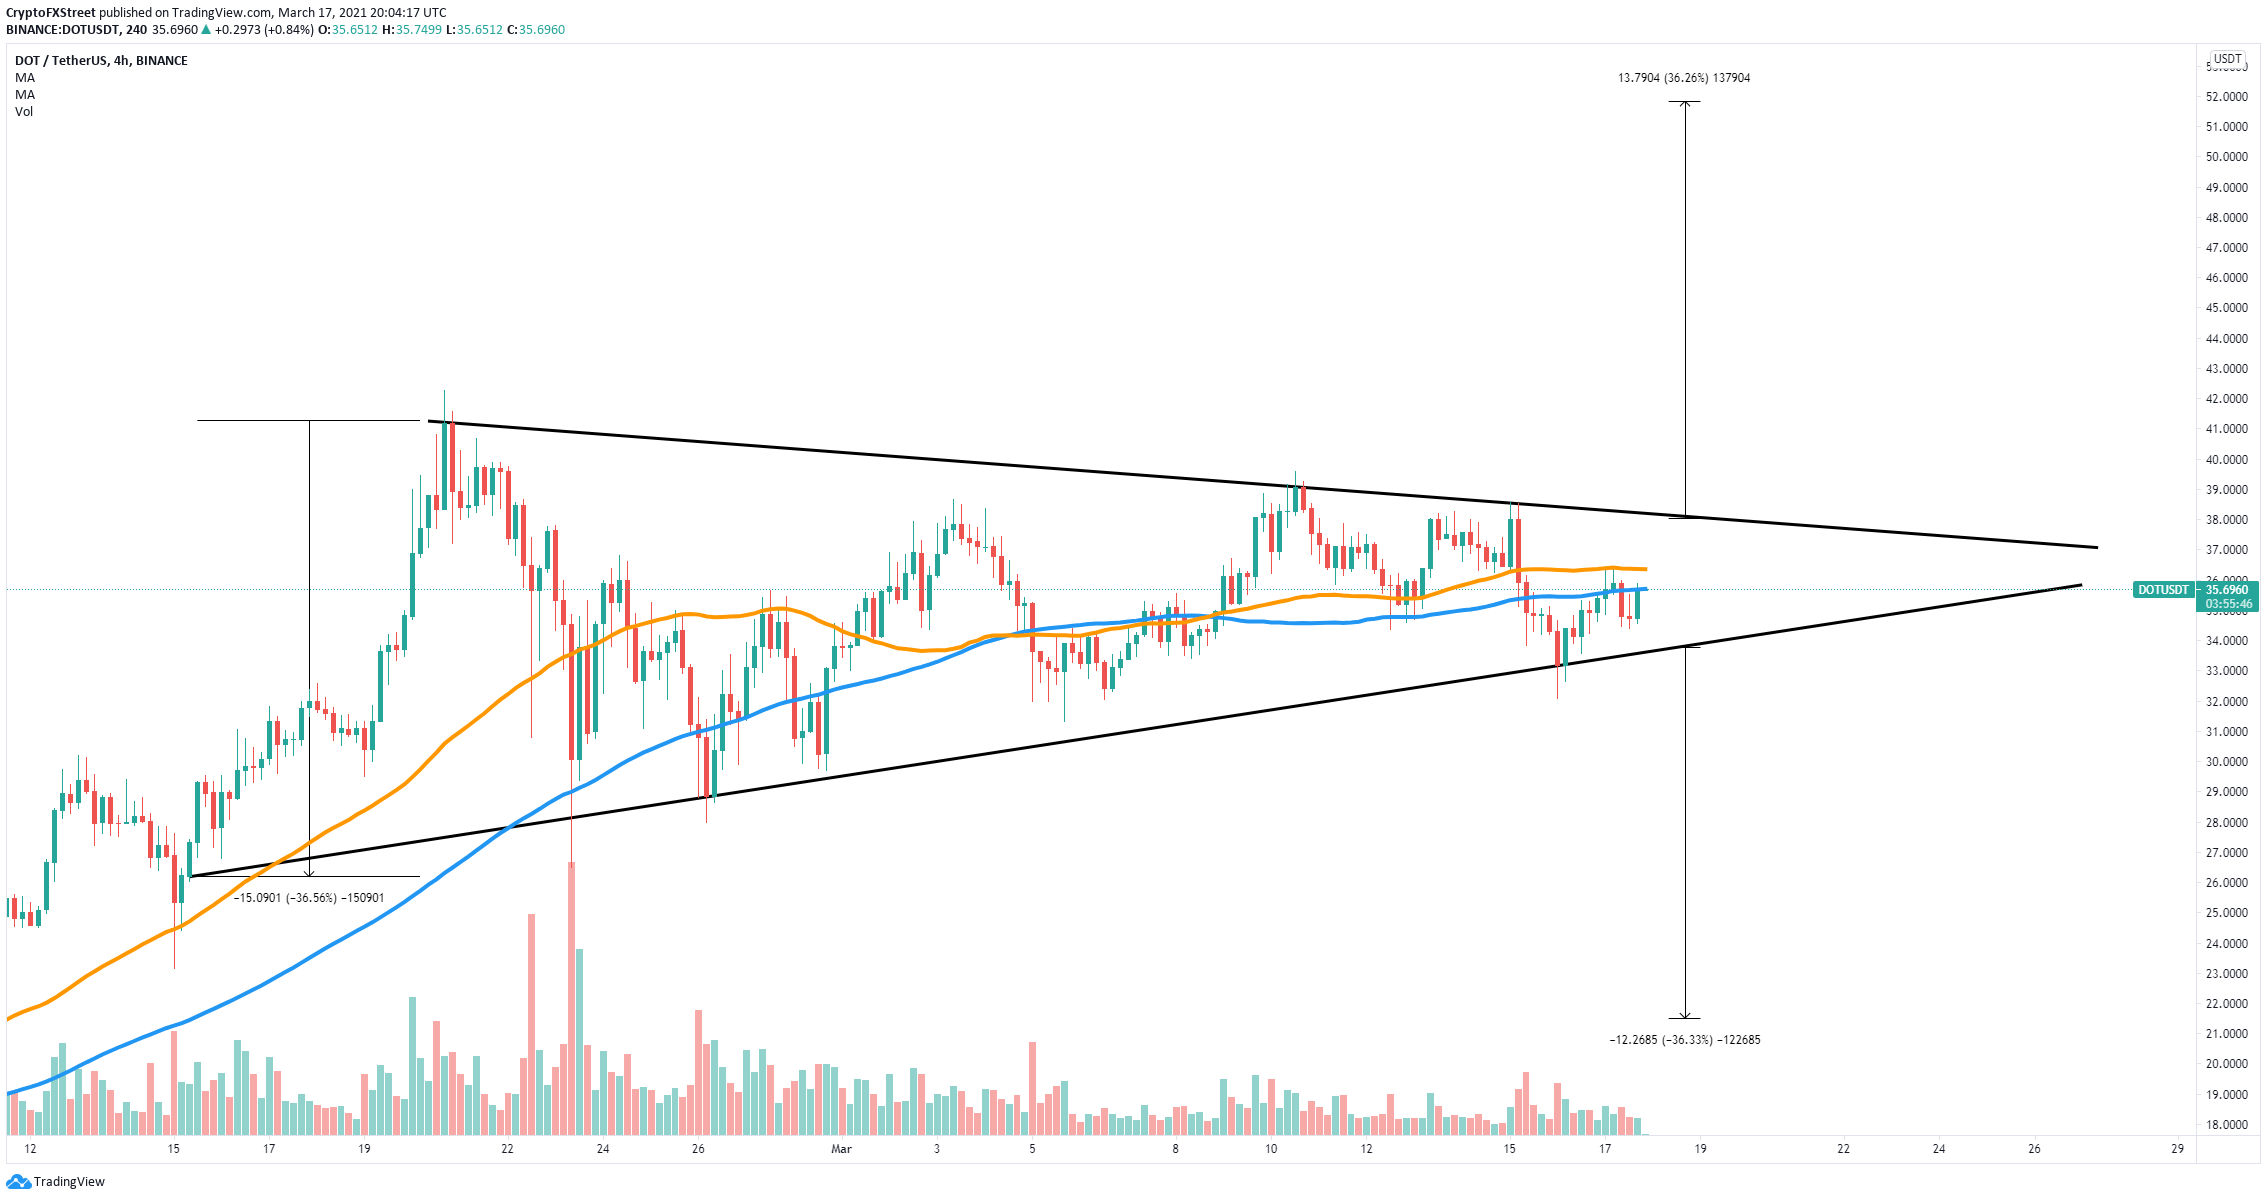
- Polkadot price is bounded inside a symmetrical triangle pattern on the 4-hour chart.
- The digital asset faces steep resistance above its current price.
- DOT is on the verge of a massive 36% move within the next 48 hours.
Polkadot has been trading in a tightening range since February 21 and seems ready for a significant move. DOT bulls face steep barriers ahead, but a breakout is still in the cards.
Polkadot price faces strong selling pressure
On the 4-hour chart, Polkadot price has established a symmetrical triangle pattern with its resistance trendline formed at $38.2 and support at $33.7.
DOT/USD 4-hour chart
The 50-SMA and 100-SMA are acting as strong resistance levels, and Polkadot price has been rejected already several times in the past 24-hours. A breakdown below $33.7 will push Polkadot towards $31 in the short-term and as low as $21.5 in the long-term.
To invalidate the bearish outlook, Polkadot buyers will need to push the digital asset above the 50-SMA and 100-SMA, but they will still face the key resistance trendline at $38.2. A breakout above this point should drive Polkadot to new all-time highs at $52 with a pause at $40 and $42.4 first.

