- DOT price is up by 16% in the past 48 hours following the lead of Bitcoin.
- The digital asset could be facing a notable rejection as the TD Sequential indicator is on the verge of presenting a sell signal.
Polkadot had a massive rally towards $6.86 on September 1, shortly after getting listed on major exchanges and reaching a multi-billion market capitalization. Since then, DOT’s price has declined by 34% trading sideways for the past month.
DOT shows signs of a short-term reversal
On the 4-hour chart, the price of DOT has climbed above the three SMAs, but it’s facing a potential sell signal which could be presented by the TD Sequential indicator in the next hour. The indicator is already showing a green ‘8’ which is usually followed by the green ‘9’ sell signal.
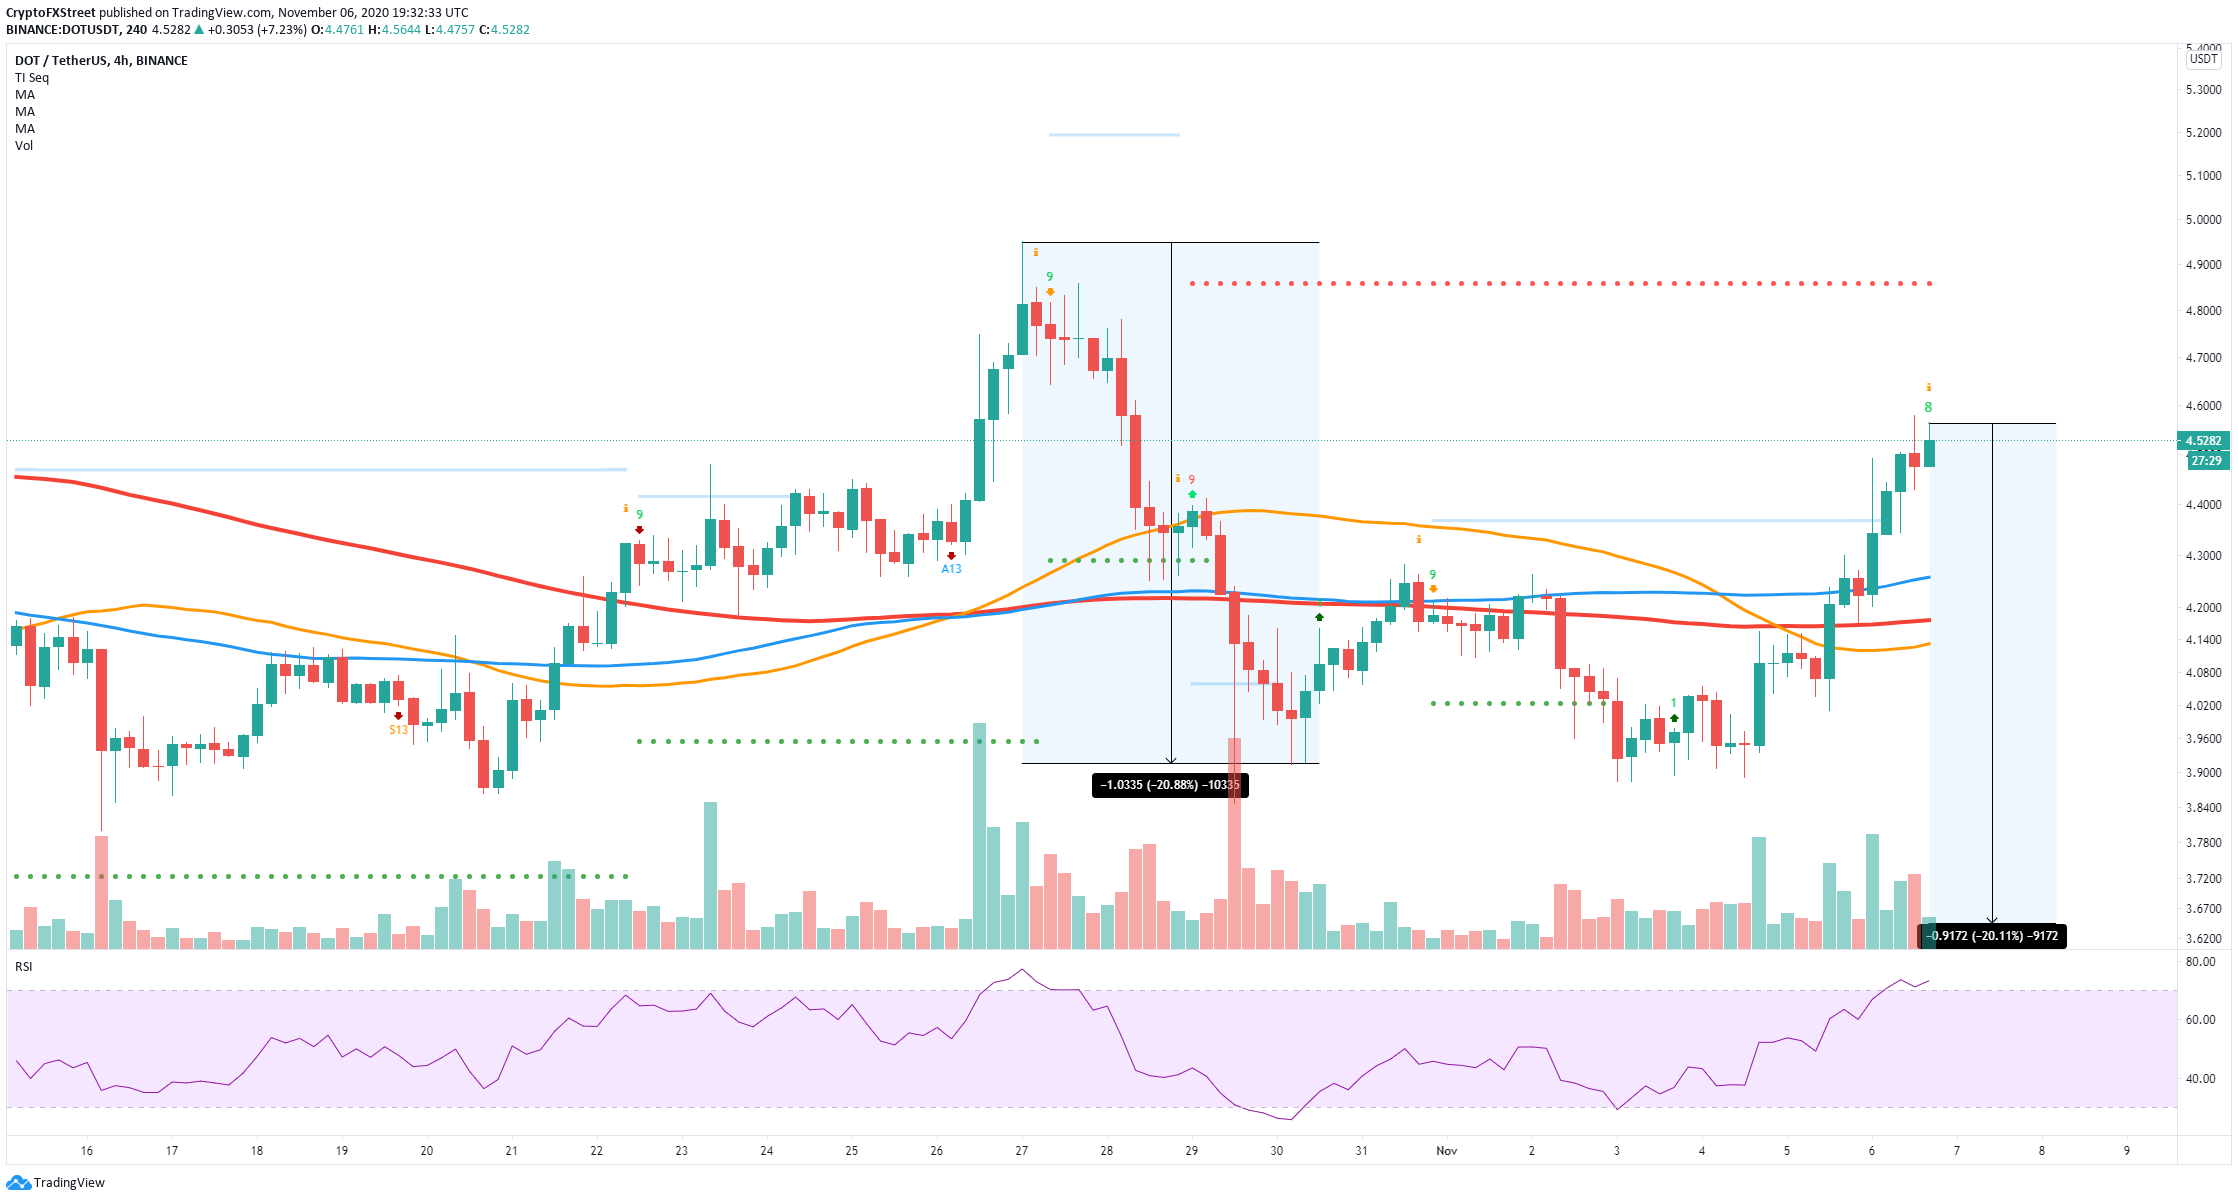
DOT/USD 4-hour chart
On top of that, the RSI is also overextended for the first time since October 26. If history repeats, we could see another 20% drop for DOT, taking the digital asset towards $3.64 as the lowest price target. The Fibonacci retracement indicator shows another potential price target at $4.2, the 50% Fib.
-637402880389425175.png)
DOT/USD 4-hour chart
It’s worth noting that a breakout above the resistance level at $4.621, the 0.236 Fib, will invalidate the sell signal and push the price of DOT towards $4.95, the high established on October 27.
