- Polkadot price is trading inside a right-angled broadening wedge on the verge of a breakdown.
- If bulls can hold a crucial support level at $22.6, DOT can quickly fall towards $20.5.
- Odds favor the bears as the entire cryptocurrency market is red in the past 24 hours.
Polkadot has been trading inside a right-angled broadening wedge on the 1-hour chart for the past 48 hours. The digital asset is on the verge of a breakdown towards $20.5 if the bulls can’t hold the key support level at $22.6.
Polkadot price at risk of falling 9% in the short-term
The most significant support level is $22.6 in the short-term as it is the lower trendline of the broadening wedge pattern on the 1-hour chart. This pattern is considered bearish and has a target equal to the height of the breakdown point to the top trendline.
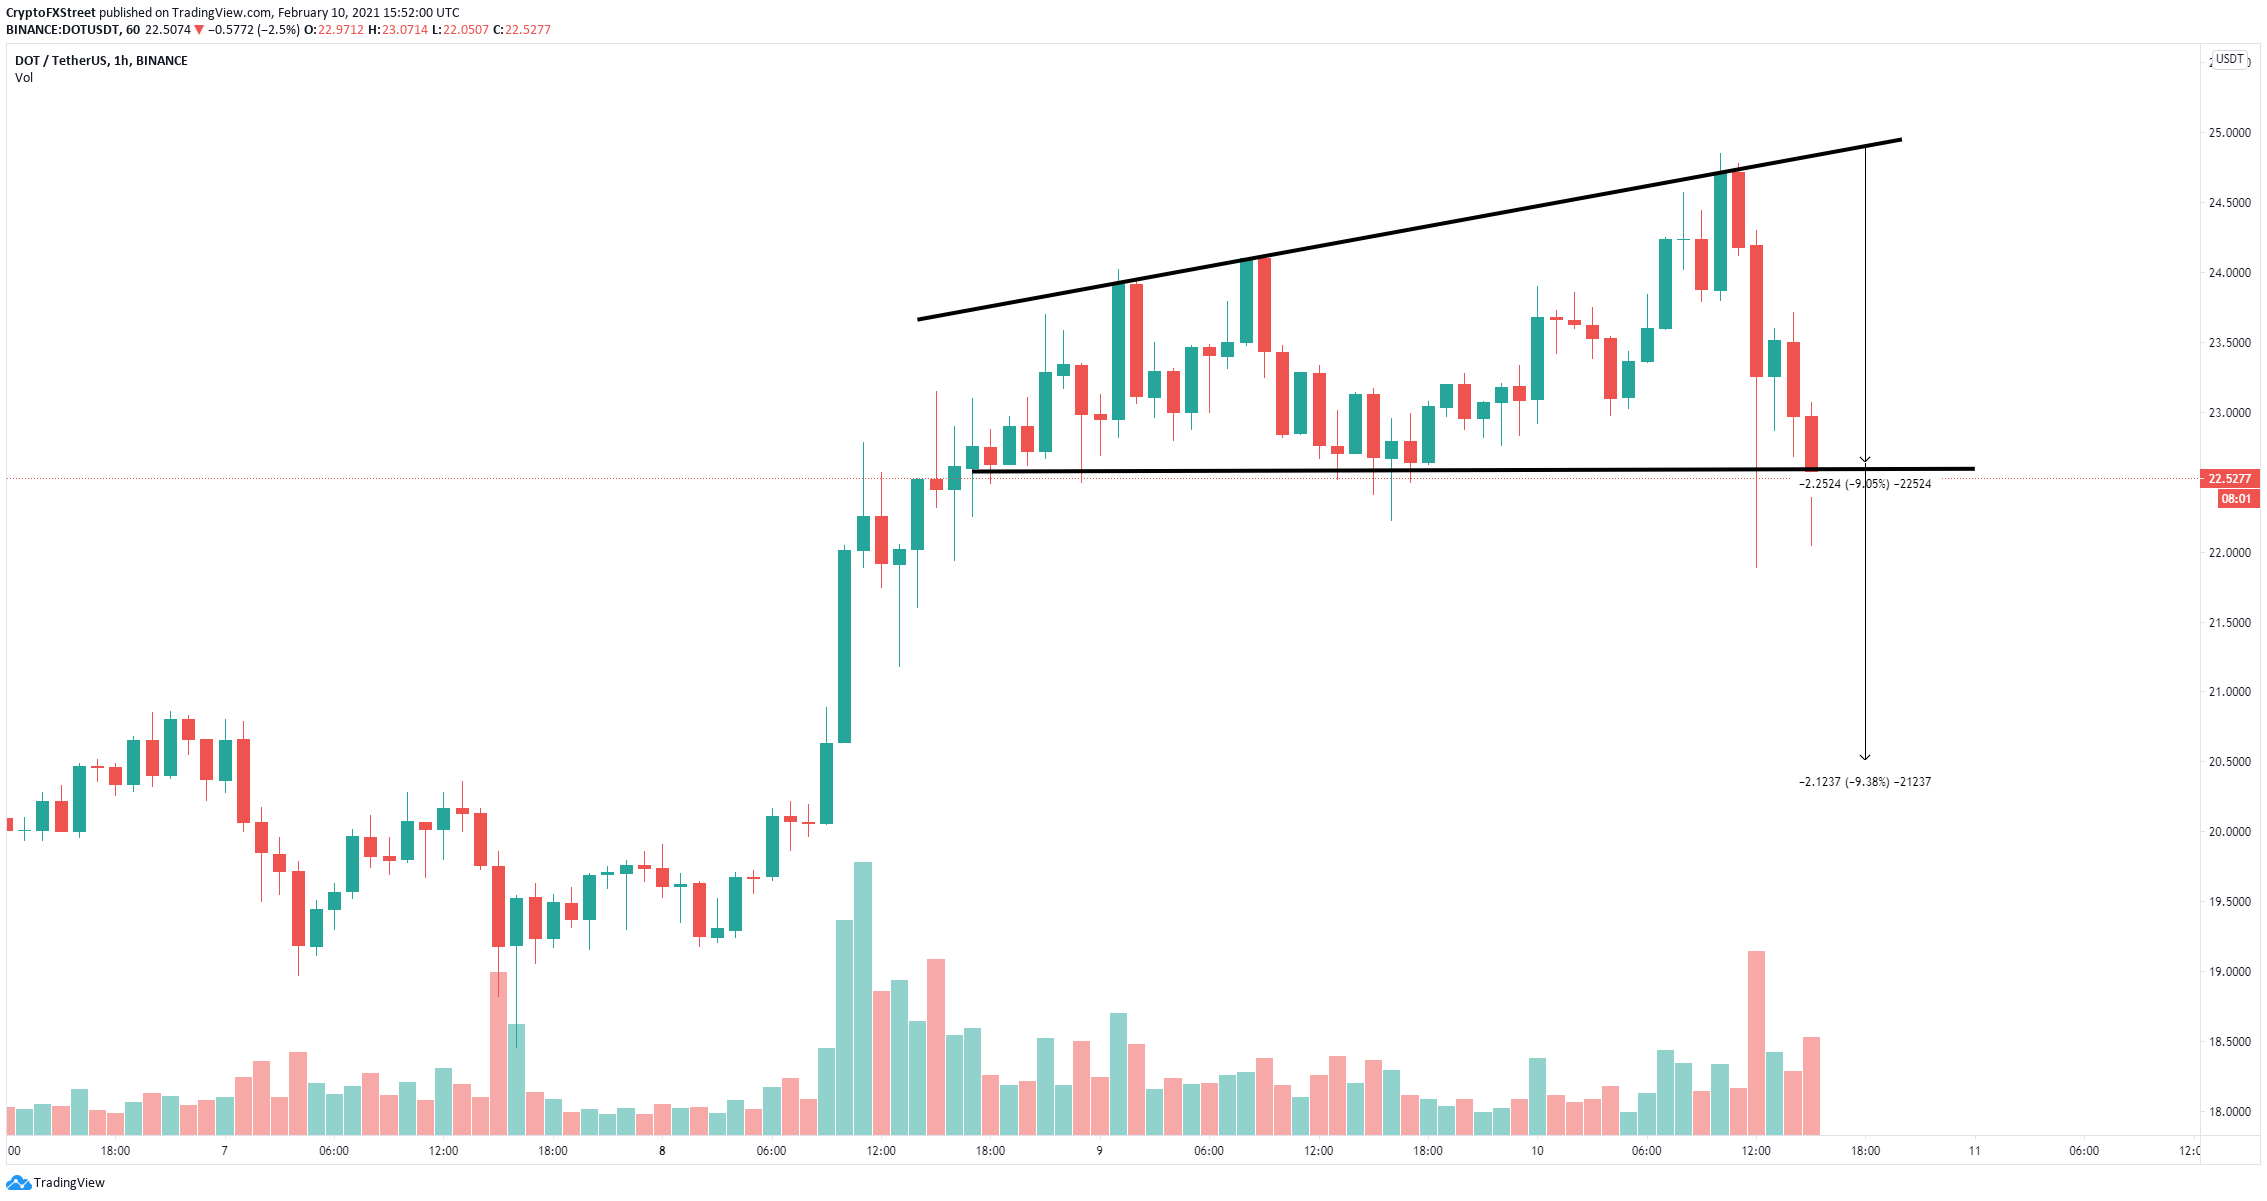
DOT/USD 1-hour chart
Additionally, to add credence to the bearish outlook, on the 12-hour chart, Polkadot price and the RSI have established a bearish divergence. The price has printed higher highs while the RSI has established several lower highs, confirming the divergence which is the strongest possible.
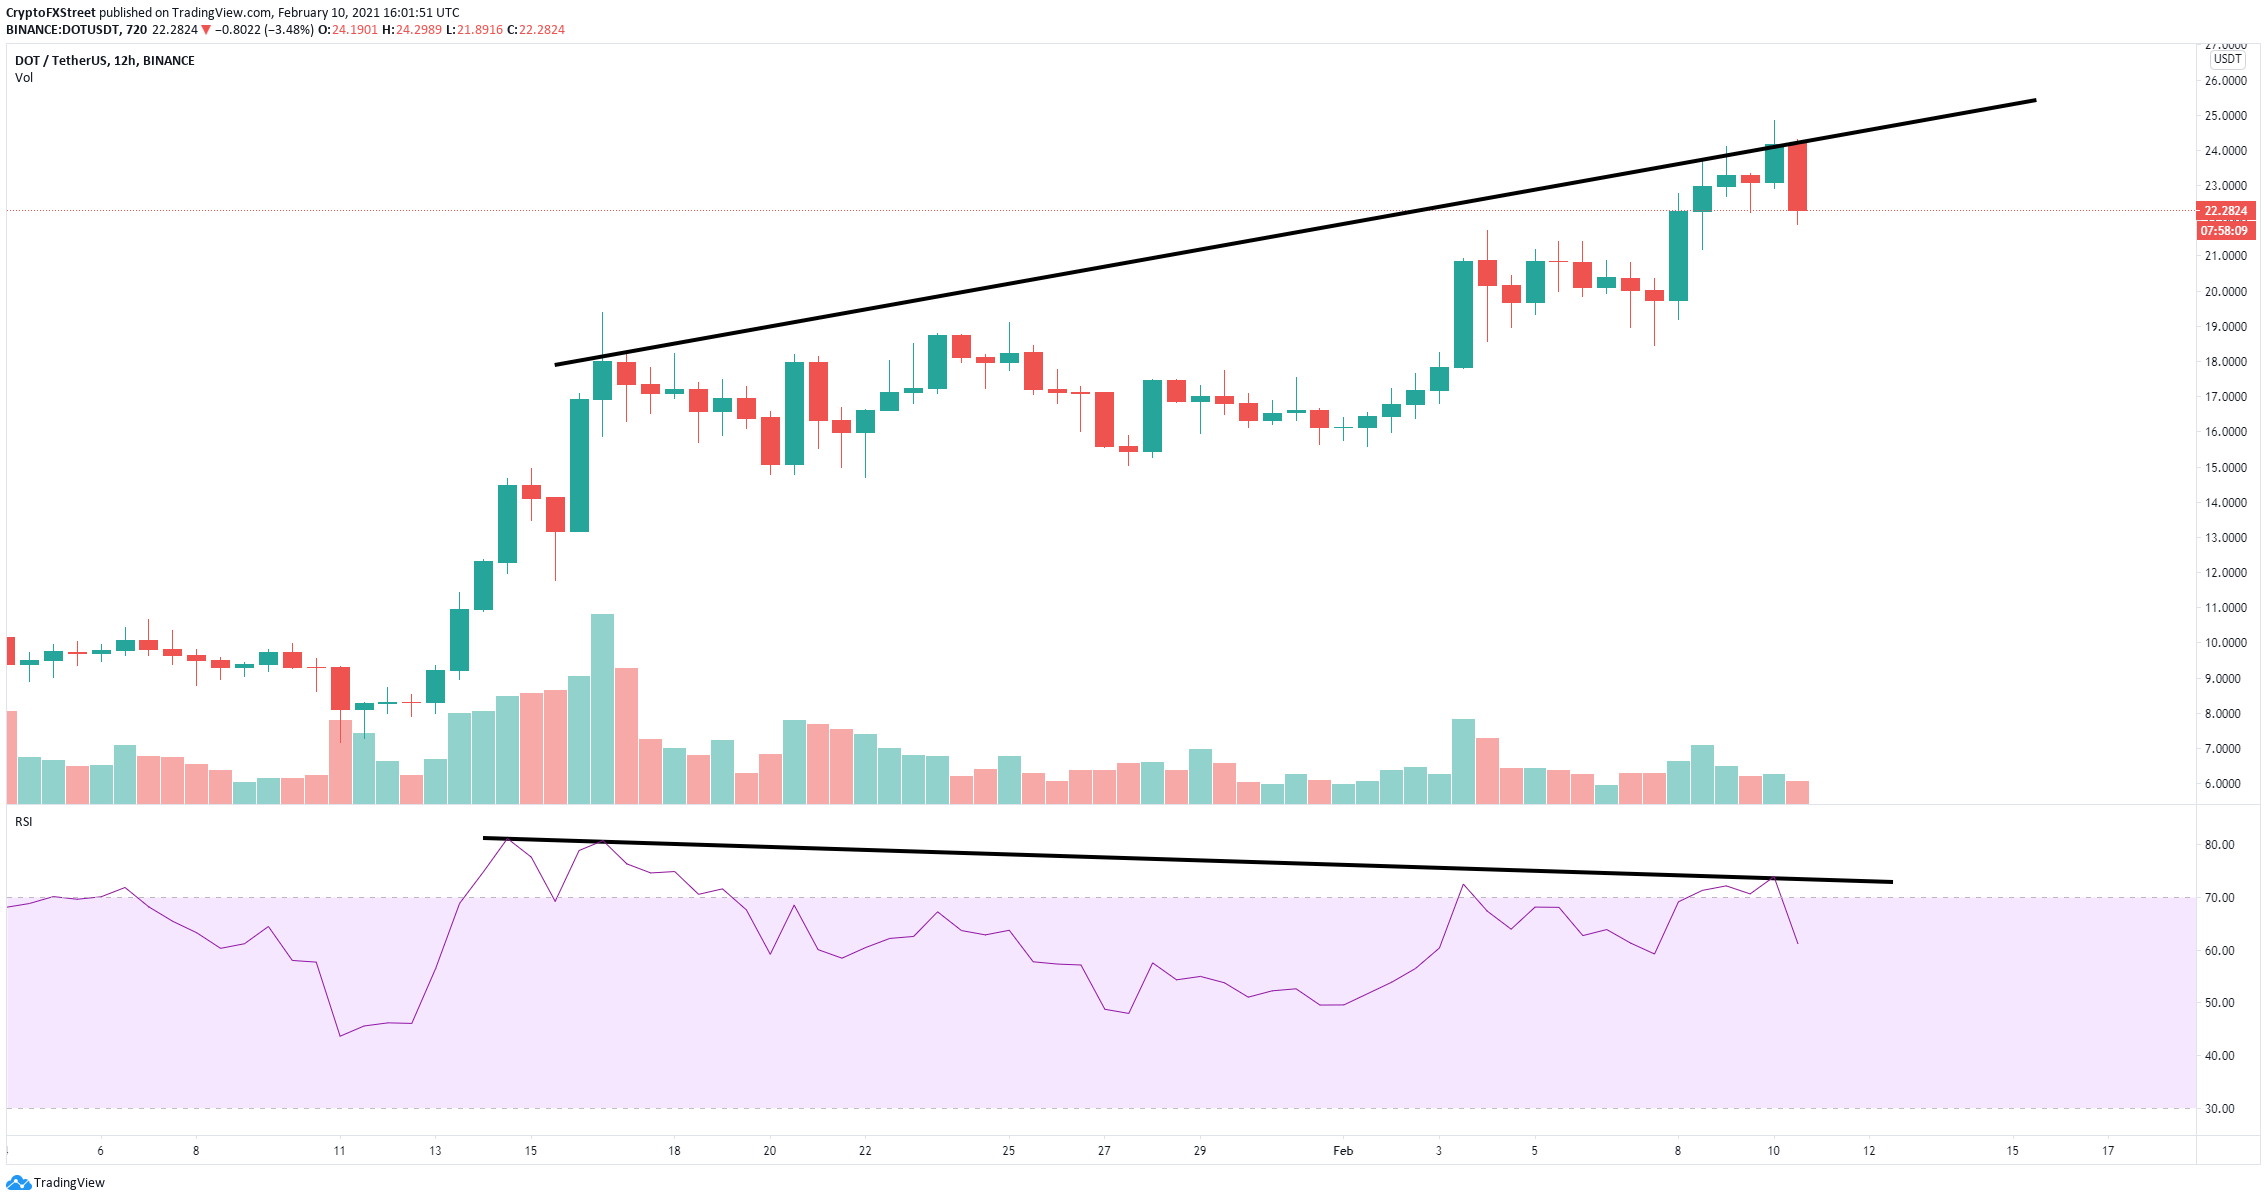
DOT/USD 12-hour chart
Nonetheless, to invalidate the bearish outlook, bulls need to hold the $22.6 support level. A rebound from this point can push Polkadot price to $25 towards the top trendline of the broadening wedge pattern.
