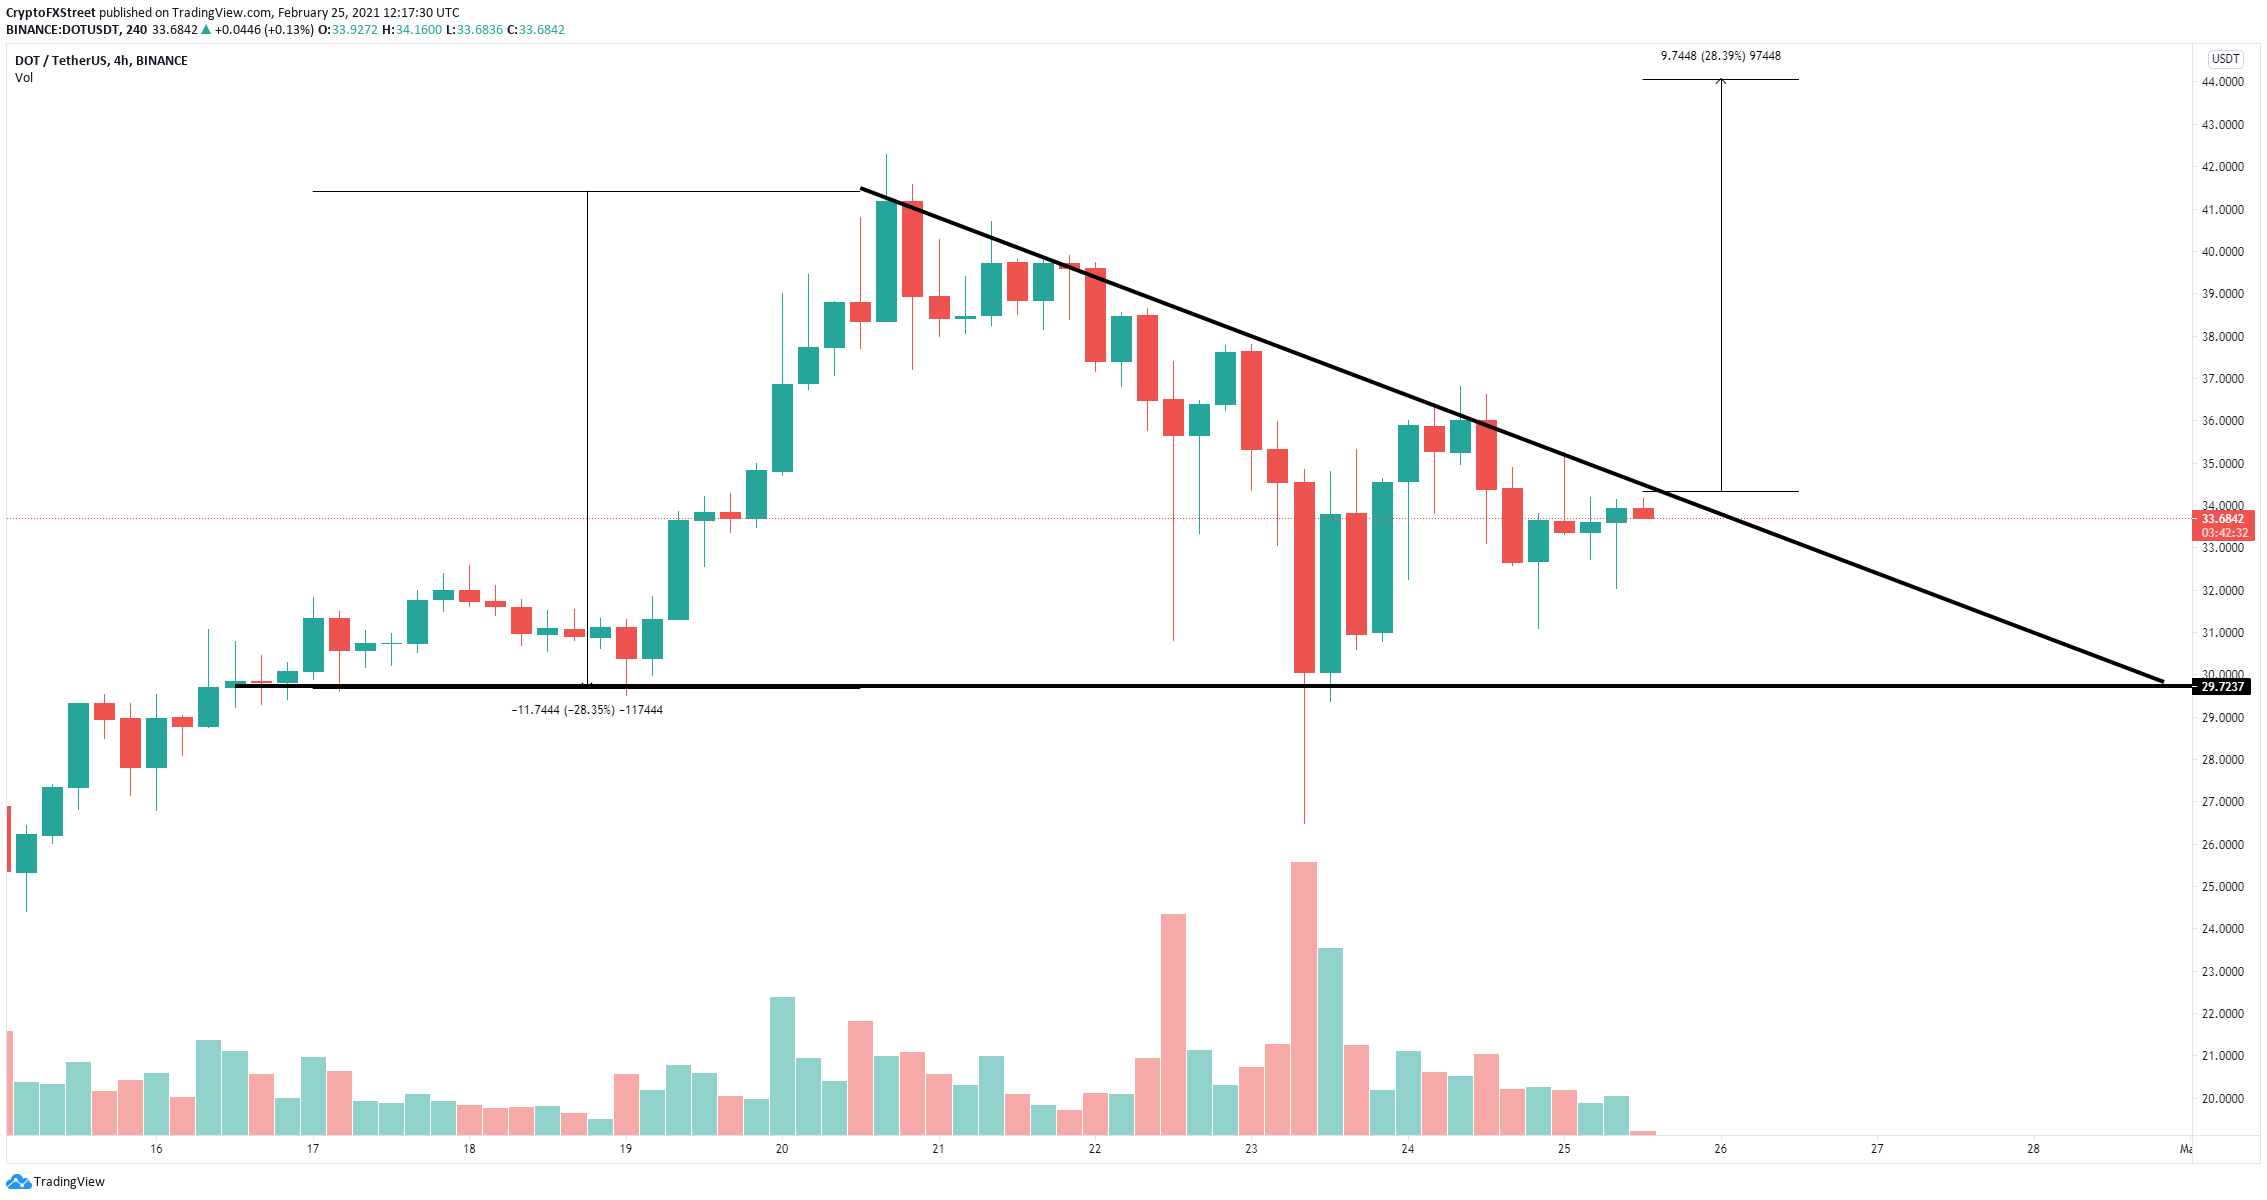
- Polkadot price is contained inside a descending triangle pattern on the 4-hour chart.
- DOT faces only one critical resistance level before a massive 30% breakout.
- Polkadot bulls seem to have the upper hand after establishing a higher low.
Polkadot had a significant correction from its all-time high of $42.28 down to a low of $26.5. However, the digital asset has recovered and seems ready for a new leg up if a critical resistance barrier at $34 breaks.
Polkadot price could rally to new all-time highs on descending triangle breakout
On the 4-hour chart, Polkadot price has established a descending triangle pattern with a clear resistance level located at $34. The current price is right below this key barrier.
DOT/USD 4-hour chart
A breakout above $34 should quickly drive Polkadot price towards $44, a 28% move calculated using the height from the top of the pattern to the lower trendline. The trading volume of Polkadot has declined notably in the past 24 hours which indicates that a major move might be underway.
However, if Polkadot price is rejected at the key resistance level of $34, the digital asset can plummet down to the lower boundary of the descending triangle pattern at $30.

