- Polkadot price nurtures a rising parallel channel towards $30.
- A break above the 200-day SMA is a big milestone for DOT bulls.
- Polkadot must close the day above $22 to affirm the bullish narrative.
Polkadot is trading in the green following a whooping 112% rally from the July 20 low at $10.5. As predicted last week on August 04, a break above the $18.79 major resistance level would see Polkadot price explore areas around $22. At the time of writing, DOT is exchanging hands at $22.15 with buyers focused on stretching the bearish leg further.
Polkadot Price Nurtures An Ascending Parallel Channel Targeting $30
Since July 21 DOT/USD price action has formed an ascending parallel channel on the 12-hour chart. The channel’s lower boundary provided significant support that ensured that overhead pressure was kept at bay. On the other hand, bullish pressure was continuously rejected by the upper boundary. Meanwhile, the August 07 break above the middle boundary is an indication that Polkadot’s price prediction remains bullish.
- If you wish to trade Polkadot, visit these crypto brokers to get started.
Overcoming the 200-day SMA barrier at $21.59 was a major milestone for DOT as it prepares for the big push. A daily closure above this level will bolster the bulls to push Polkadot beyond the June 03 high towards $30 as defined by the upper boundary of the ascending channel.
DOT/USD Daily Chart
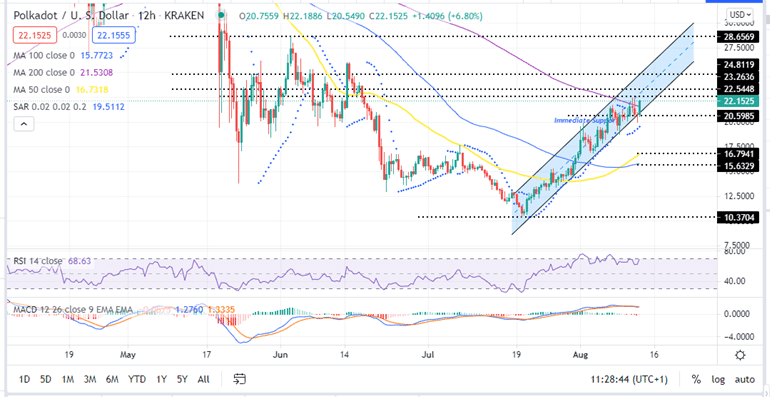
DOT’s bullish bias is accentuated by the Relative Strength Index (RSI). Its upwards movement into the overbought zone is an indication that the buyers are in control of the Polkadot price. Moreover, the position of the Moving Average Convergence Divergence (MACD) indicator in the positive region above the mean line accentuates this bullish narrative. Moreover, the parabolic SAR reversed from negative to positive on August 10 on the same 12-hour chart adding credence to this optimistic outlook.
How can DOT’s bullish narrative be invalidated?
Note that if the Polkadot price drops below 200-day SMA at $21.55 support wall, it could trigger selling orders. If this happens, the DOT price could fall outside the rising channel in a move that would see it revisit areas around the $20 psychological level. A further drop would see Polkadot drop to the 50-day SMA at $16.79 and the 100-day SMA at $15.63.
If these support areas fail to hold, Polkadot could fall to the July 20 low at $10.13 forming a double bottom before restarting the recovery.
Note that crypto signals show that Polkadot was extremely overbought on August 01, August 04 and August 07. All the three occasions were followed by a trend reversal. Therefore, the entry of the RSI could trigger a trend reversal in the near term. Moreover the movement of the MACD line (blue) below the signal line accentuates this bearish outlook.
Looking to buy or trade Polkadot now? Invest at eToro!
Capital at risk
