- Polkadot price is up by 108% since December 28, 2020 hitting a market capitalization of $9 billion.
- The digital asset is on its way to becoming the 6th largest cryptocurrency after a meteoric rise.
Polkadot has been trading inside a massive uptrend since December 28 after a long period of sideways trading since September. The digital asset experienced an explosive increase in trading volume in the past week which adds credence to the bulls.
Polkadot price must hold critical support level against Bitcoin to continue rising
On the 4-hour chart of DOT/BTC, Polkadot has been trending downwards since January 4. At 0.00025 BTC there is a crucial support level that DOT must hold at all costs to see another leg up against Bitcoin.
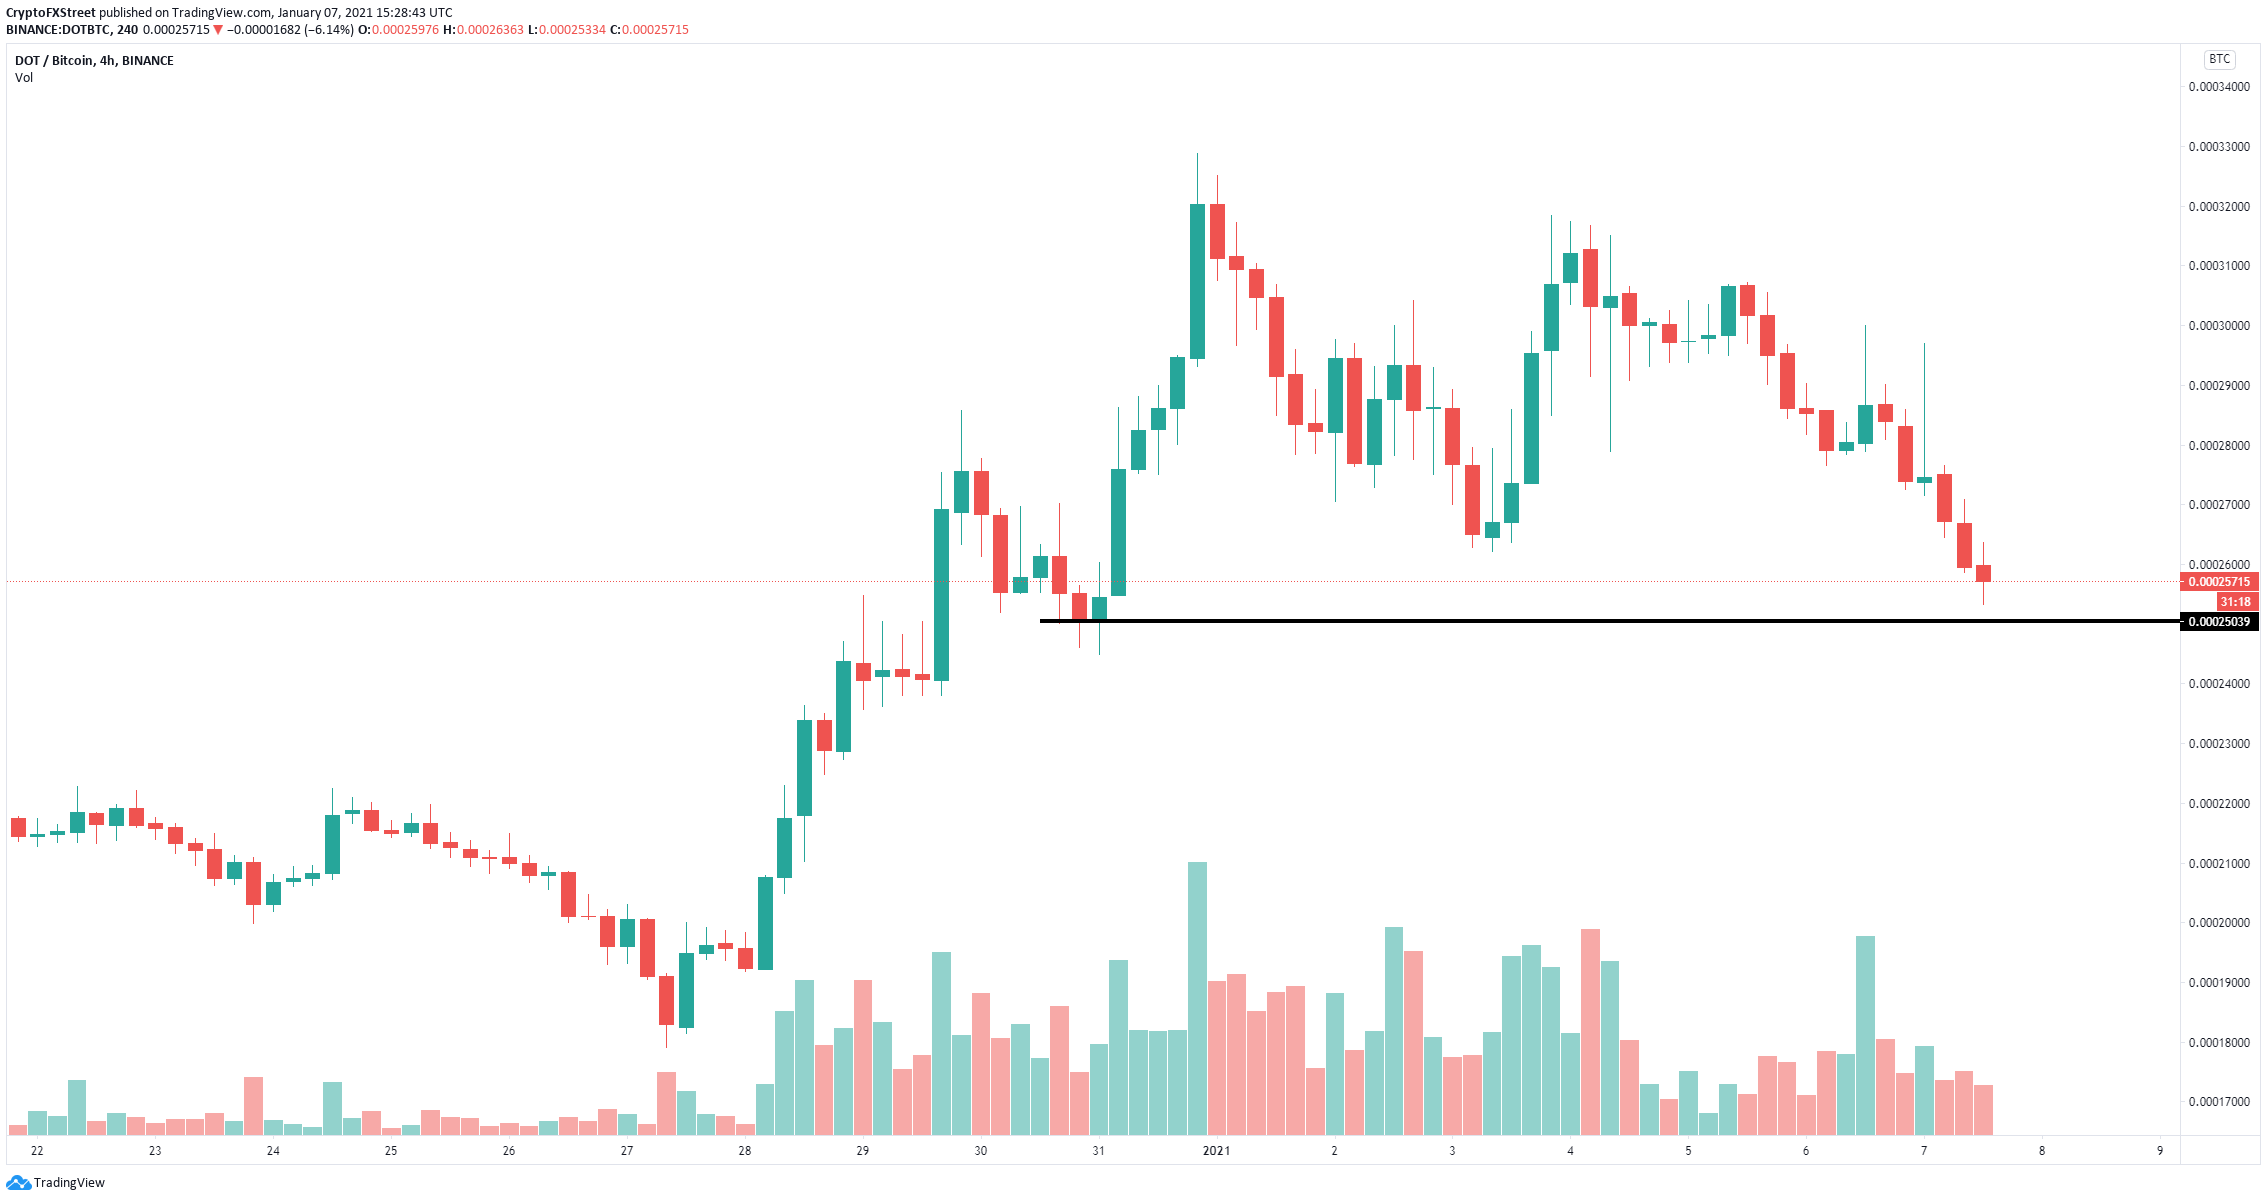
DOT/BTC 4-hour chart
On the 4-hour chart of DOT/USD, Polkadot price has held above a strong trendline which coincides more or less with the 26-EMA. As long as DOT remains above both levels, the uptrend will remain intact. Bulls aim to break $10.68 next.
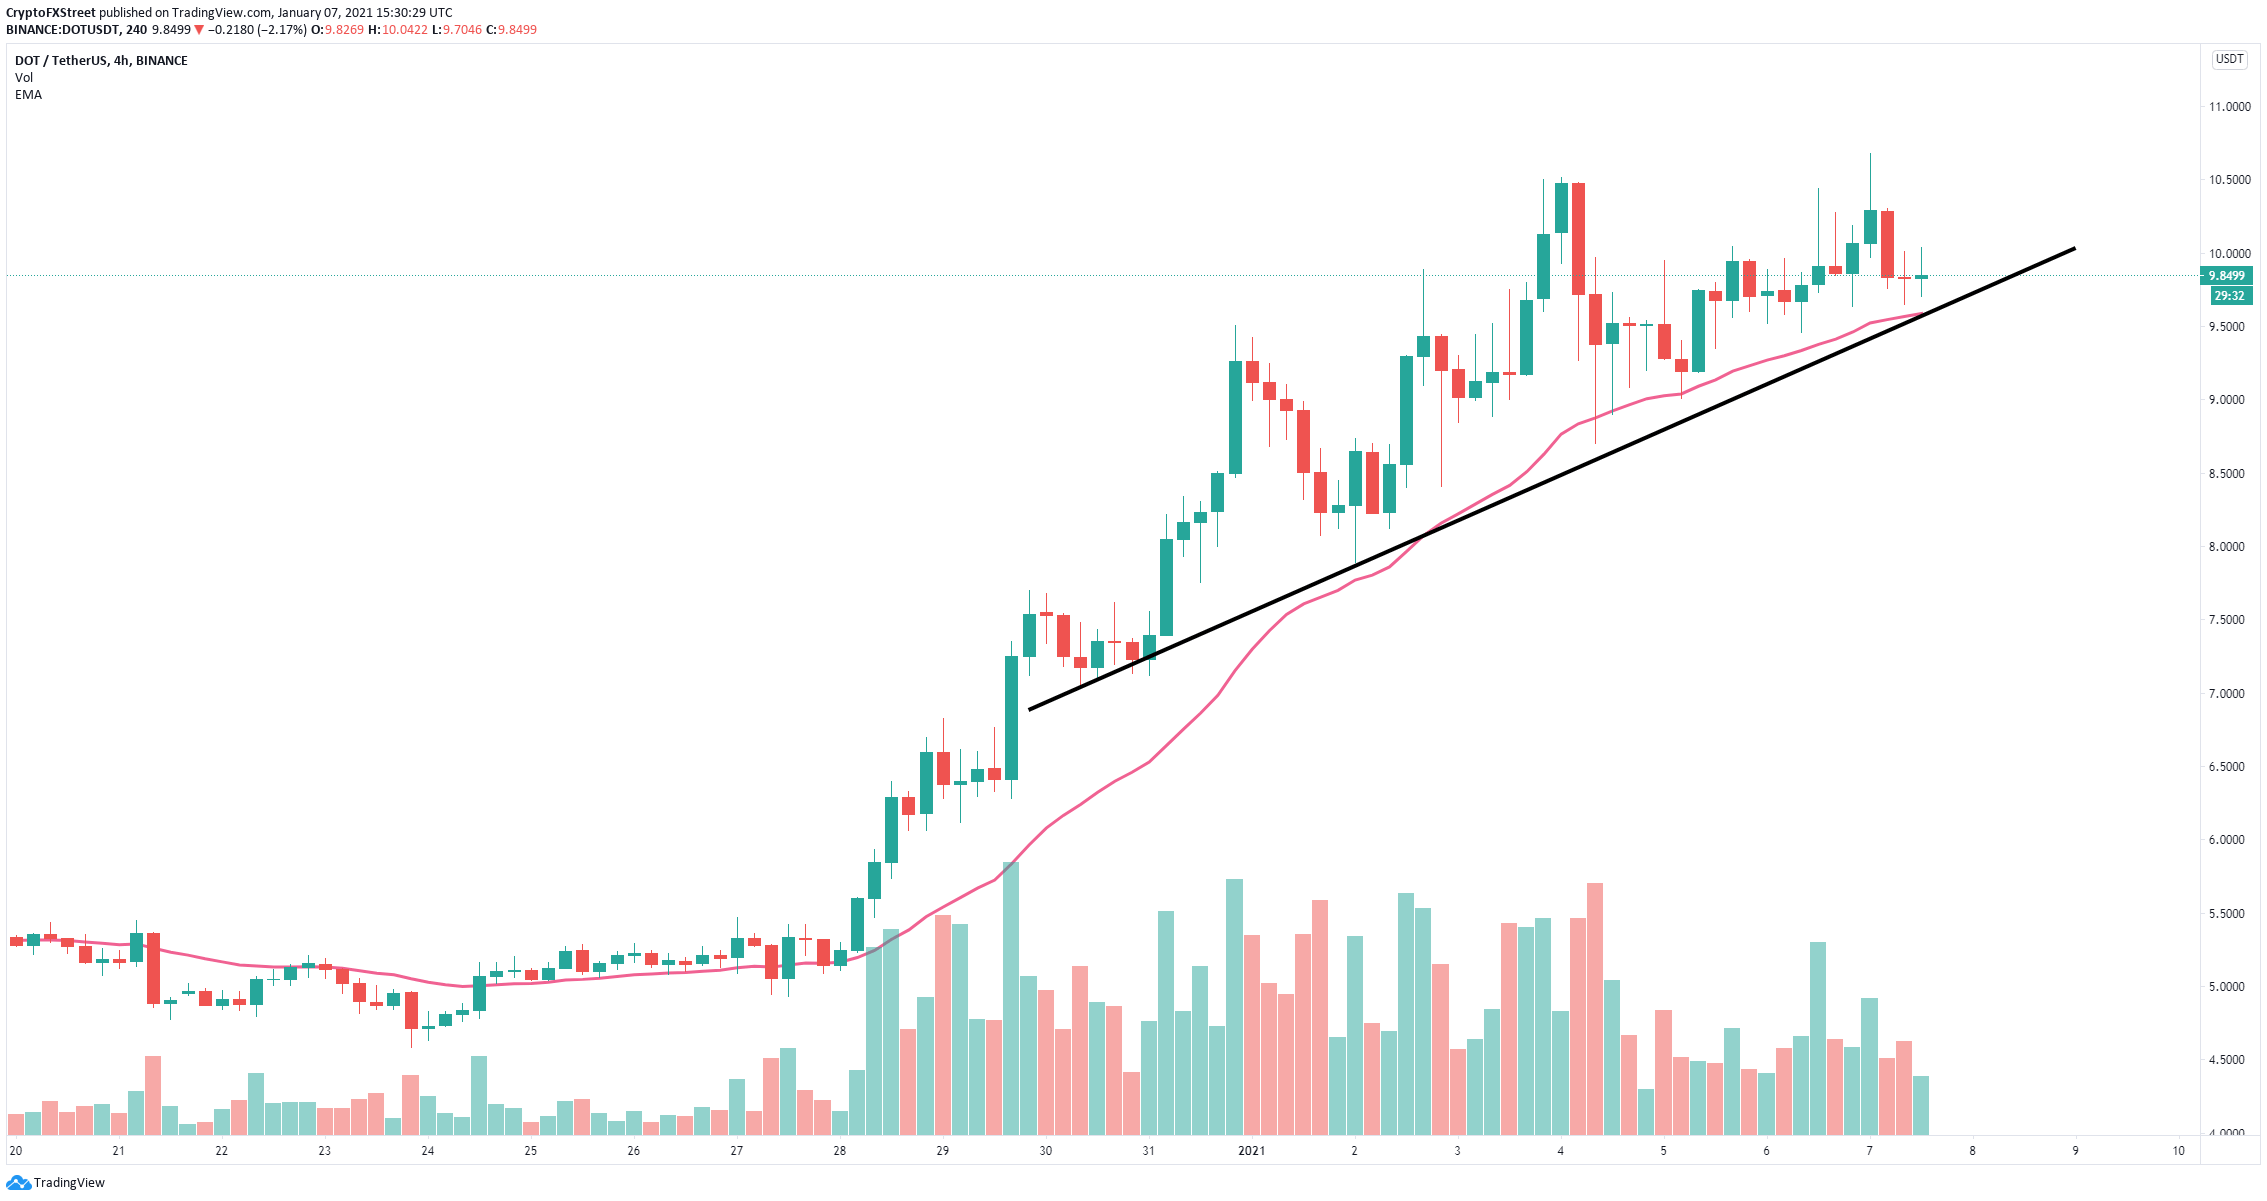
DOT/USD 4-hour chart
However, the digital asset is already fairly extended after a 100% breakout in the past week which means it might be poised for a correction first before resuming the uptrend.
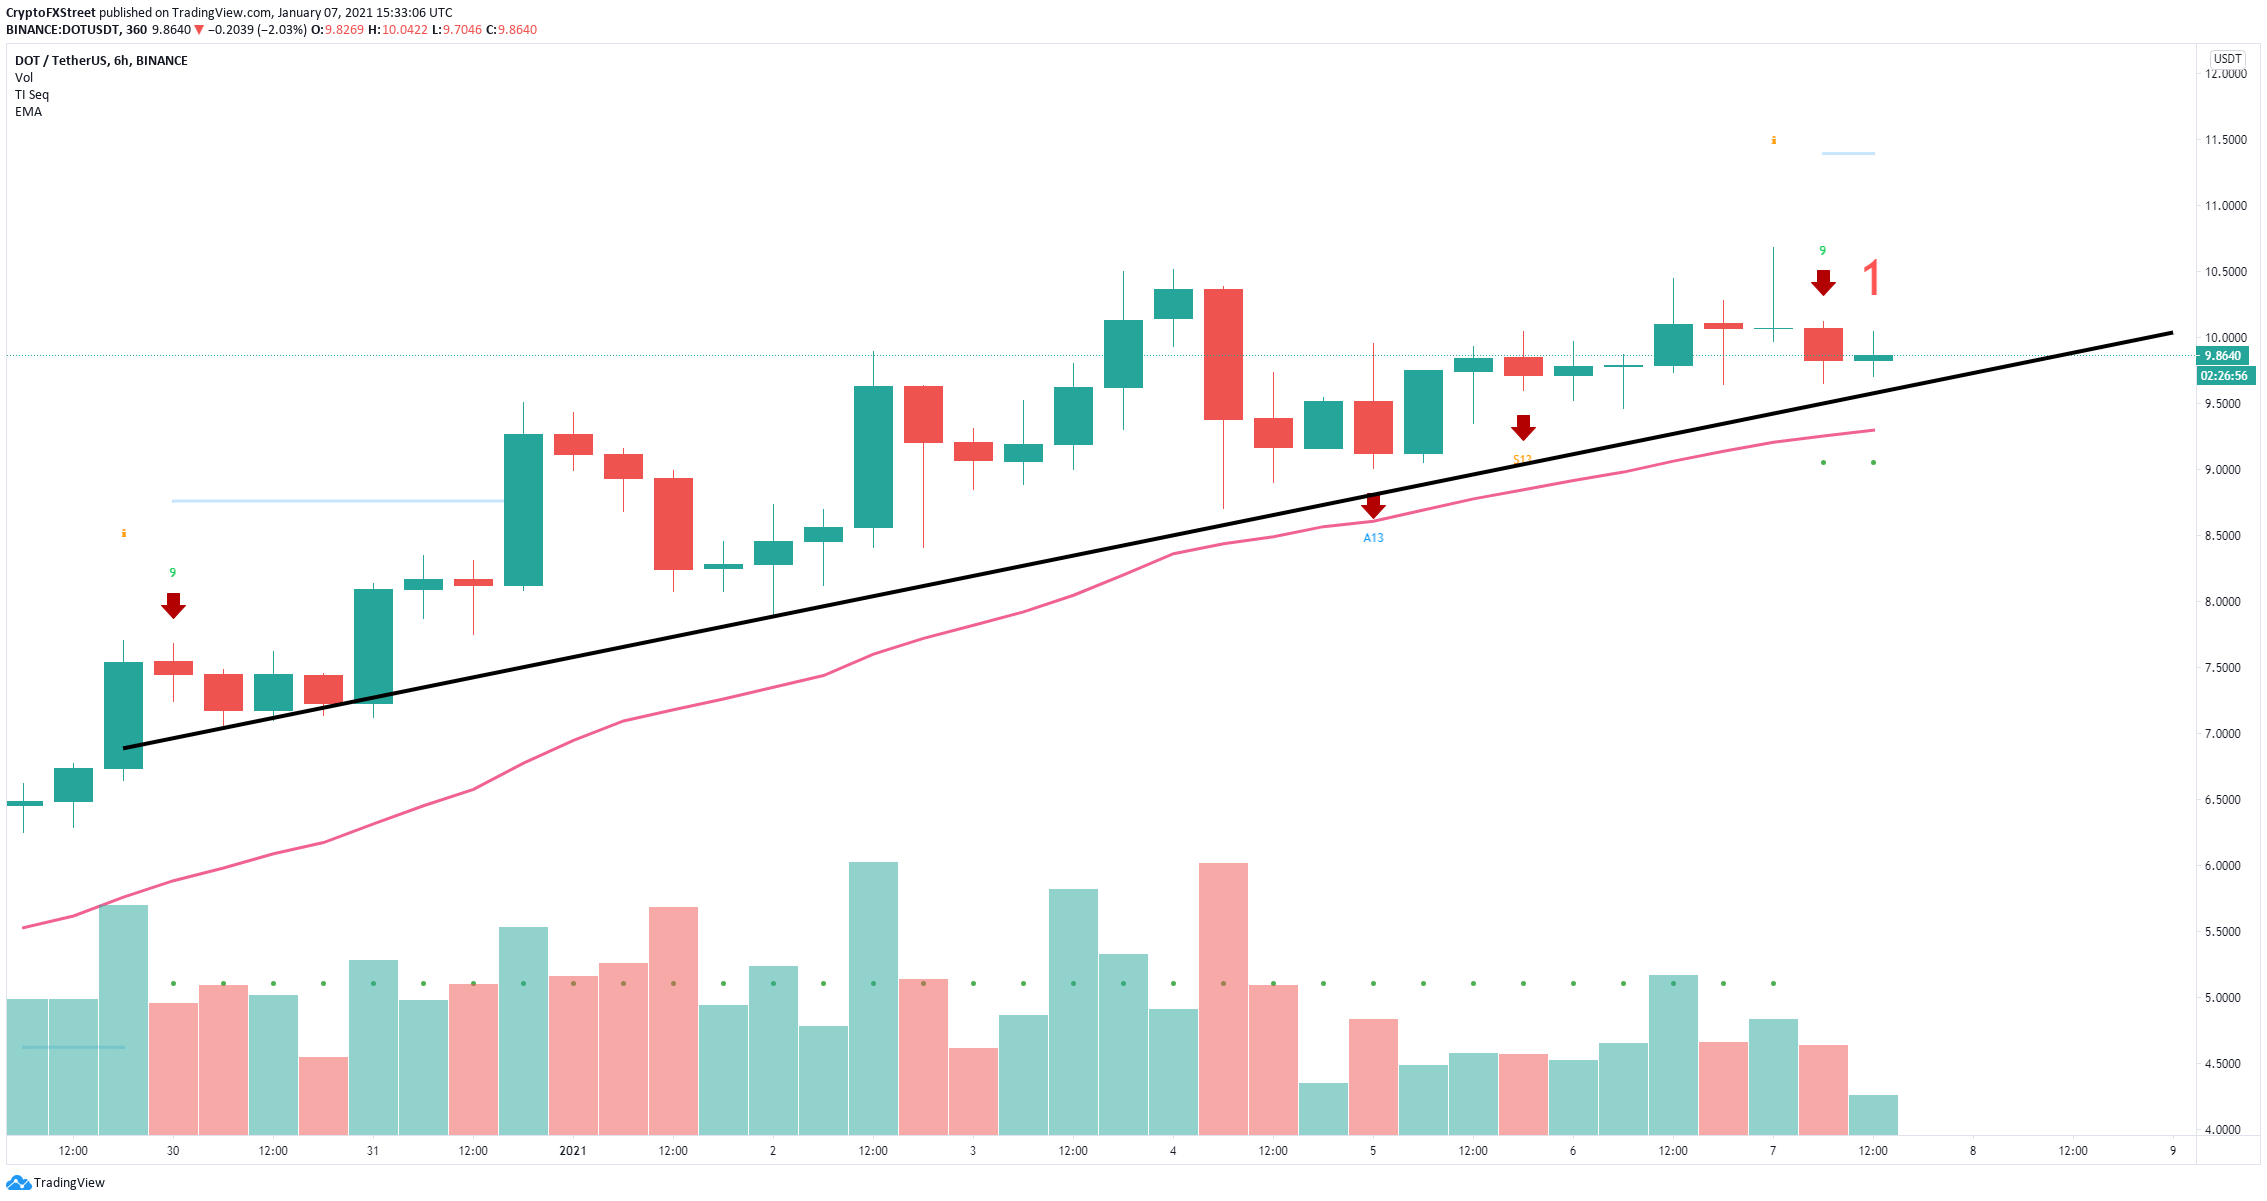
DOT/USD 6-hour chart
On the 6-hour chart, the TD Sequential indicator has presented a sell signal for the first time since December 30. Validation of the call could push Polkadot price below the strong trendline and the 26-EMA towards $9.
