- Polkadot price extends recoil from recent support at $23.70, coming face to face with the stubborn hurdle at $26.90.
- The MACD is about to flip massively bullish, triggering gains towards $28.
- DOT investors may look for a buy trade above $27.339 to target of $28 in the near term.
Polkadot price is trading in the green towards the end of trading day on Thursday. This bullish outlook appeared after DOT embraced from the rising channel’s middle boundary following a correction from the recently traded three-month high roughly at $27.33.
Meanwhile, the digital asset is exchanging hands at $25.63 after the uptrend was rejected at $26.90. The seller congestion at this area remains intact, challenging recovery attempts that are eyeing a breakout above the upper boundary of the ascending channel.
Polkadot Price Is Bullish But Resistance Galore
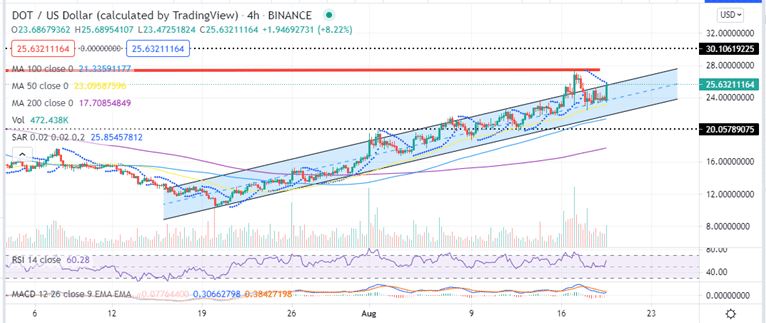
The short-term technical picture appears to have flipped bullish as DOT/USD price lifted from an intraday low at $23.50 . According to the four-hour chart, the Moving Average Convergence Divergence (MACD) indicator would present a buy signal in the nearest future particularly if the barrier posed by the ascending channel’s upper boundary at $25.65 is overcome.
The bulls must keep the price above $25, a move that could ensure market stability and increase the chances of the MACD turning bullish. In the meantime, remaining above the mean line in the positive region favors the bulls, but the MACD line (blue) cross above the signal line (orange) to validate the recovery and give bulls a boost to crack the barrier at $25.65.
Moreover, the Relative Strength Index (RSI) adds credence to this bullish narrative by its upward movement from the midline towards the overbought zone. Its value is held above 60.91 in the buy zone. This means that, bulls are likely to take control above the $25.65 resistance level. On the 4-hourly chart, the red line is holding at the Tuesday high at $27.339. This is slightly below the June 03 high. Thus, DOT has the chance of continuing the bullish trend until the $28 psychological level.
The crypto trading platform participants may look for a buy trade above the August 17 high at $27.339 to target of $28.
DOT/USD Four-Hour Chart
Looking Over the Fence
On the downside, the odds of DOT turning bearish in the short term are low as Polkadot’s price is reinforced by the ascending channel. However, closing the day below the rising channel’s middle boundary at $23.70 could see DOT tank below the 50 SMA at $23.07 to retest the support at 100 SMA at $21.40.
Therefore, selling can be seen below the 50 SMA breakout at $23.07 with a target of $21.40.
- Read this guide on crypto brokers to get you started on trading Polkadot.
Looking to buy or trade Polkadot now? Invest at eToro!
Capital at risk
