- Polkadot hits pause slightly under $10, but the technical picture remains positive for gains towards $15.
- A pessimistic outlook will occur if the TD Sequential indicator presents and confirms a sell signal on the 3-day chart.
Polkadot has been among altcoins that have committed to following Bitcoin’s terrific rally. The token has soared over 130% from the December lows around $4.5. Despite the majestic rally, DOT still shows signs of pushing to higher levels.
Polkadot poised for another liftoff eyeing $15
At the time of writing, DOT/USD is trading at $9.8. Its immediate upside is capped by the ascending parallel channel’s middle boundary. Resuming the uptrend above this key short-term hurdle is likely to see Polkadot reclaim the support above $10.
Trading above the $10 and the channel’s upper boundary may catapult the crypto to highs around $15. The Relative Strength Index emphasizes consolidation after the indicator held onto the anchor at the midline. Recovery towards the oversold region will break the bearish divergence, thus calling for more buy orders, which may favor the expected upswing.
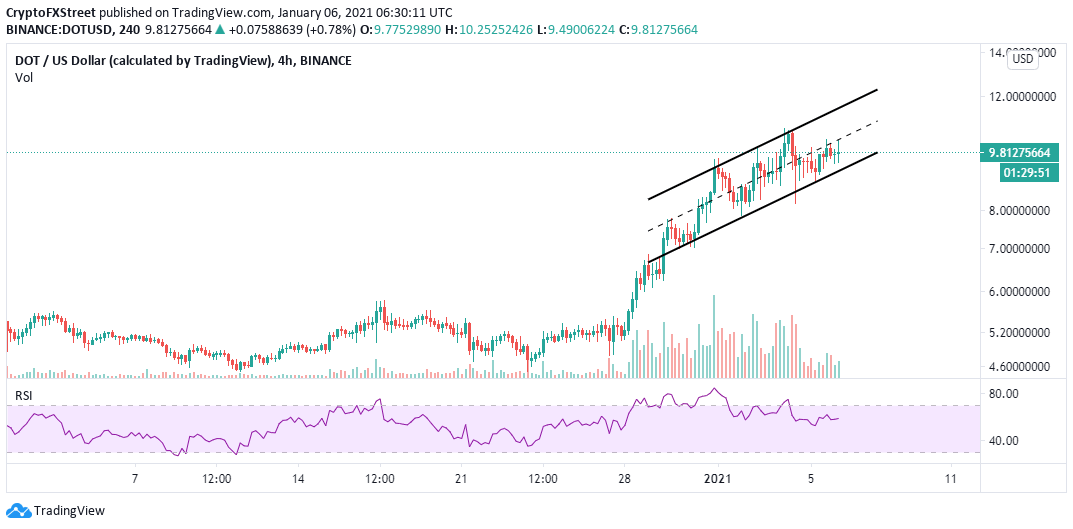
DOT/USD 4-hour chart
The same 4-hour chart shows Polkadot holding above the 78.6 Fibonacci retracement level taken between the last swing high of $10.74 and a swing low of $4.79. If this short-term support remains intact, DOT is likely to continue with the uptrend, targeting $15.
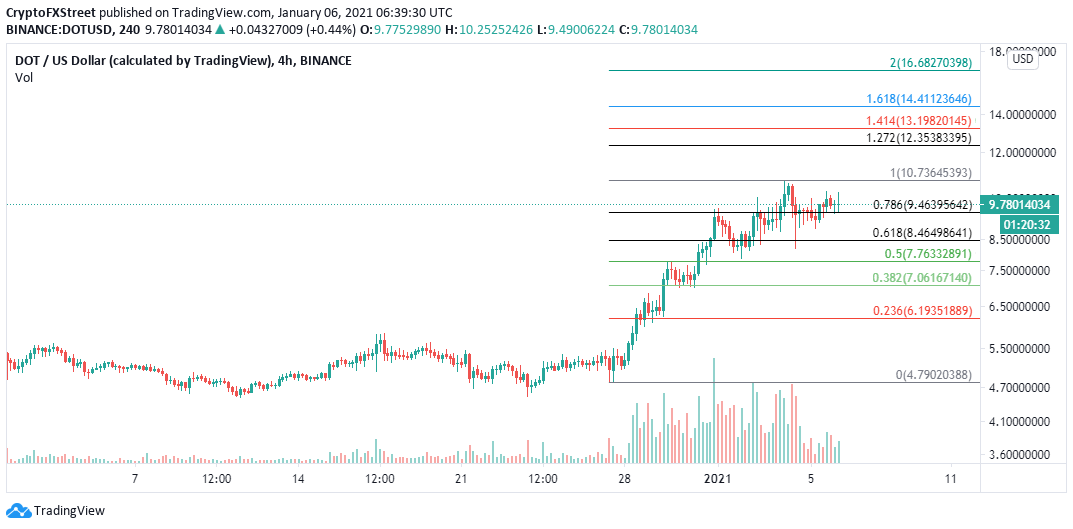
DOT/USD 4-hour chart
It is worth mentioning that Polkadot may fail to continue with the uptrend, as shown by the TD Sequential indicator. A sell signal is likely to be presented in the coming few days on the 3-day chart. The pessimistic outlook will take the form of a green nine candlestick.
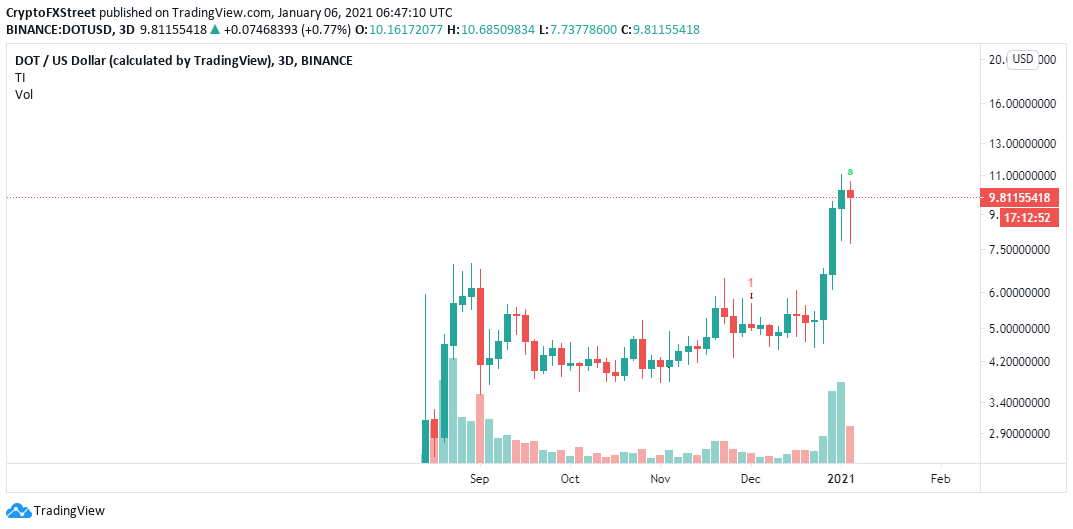
DOT/USD 3-day chart
If validated, a correction will occur in one to four 3-day candlesticks. It is worth noting that Polkadot continues to be strongly correlated to Bitcoin price action. Therefore, if BTC rallies to new all-time highs, perhaps toward $50,000 as covered earlier, DOT uptrend may well overshoot $15.
