- Polkadot price plummeted by 27% since its top at $10 on January 10.
- DOT bulls have regained the short-term uptrend and aim to resume the longer-term uptrend.
Polkadot was trading as high as $10 on January 10 before the entire cryptocurrency market collapsed. The digital asset touched $7.26 on January 11 and it’s currently trading at $8.39.
Polkadot price has to climb above $9 to see $10
The digital asset has established an hourly uptrend creating two higher highs and two lower highs. Polkadot price just climbed above the 50-SMA at $8.3 turning it into a support level.
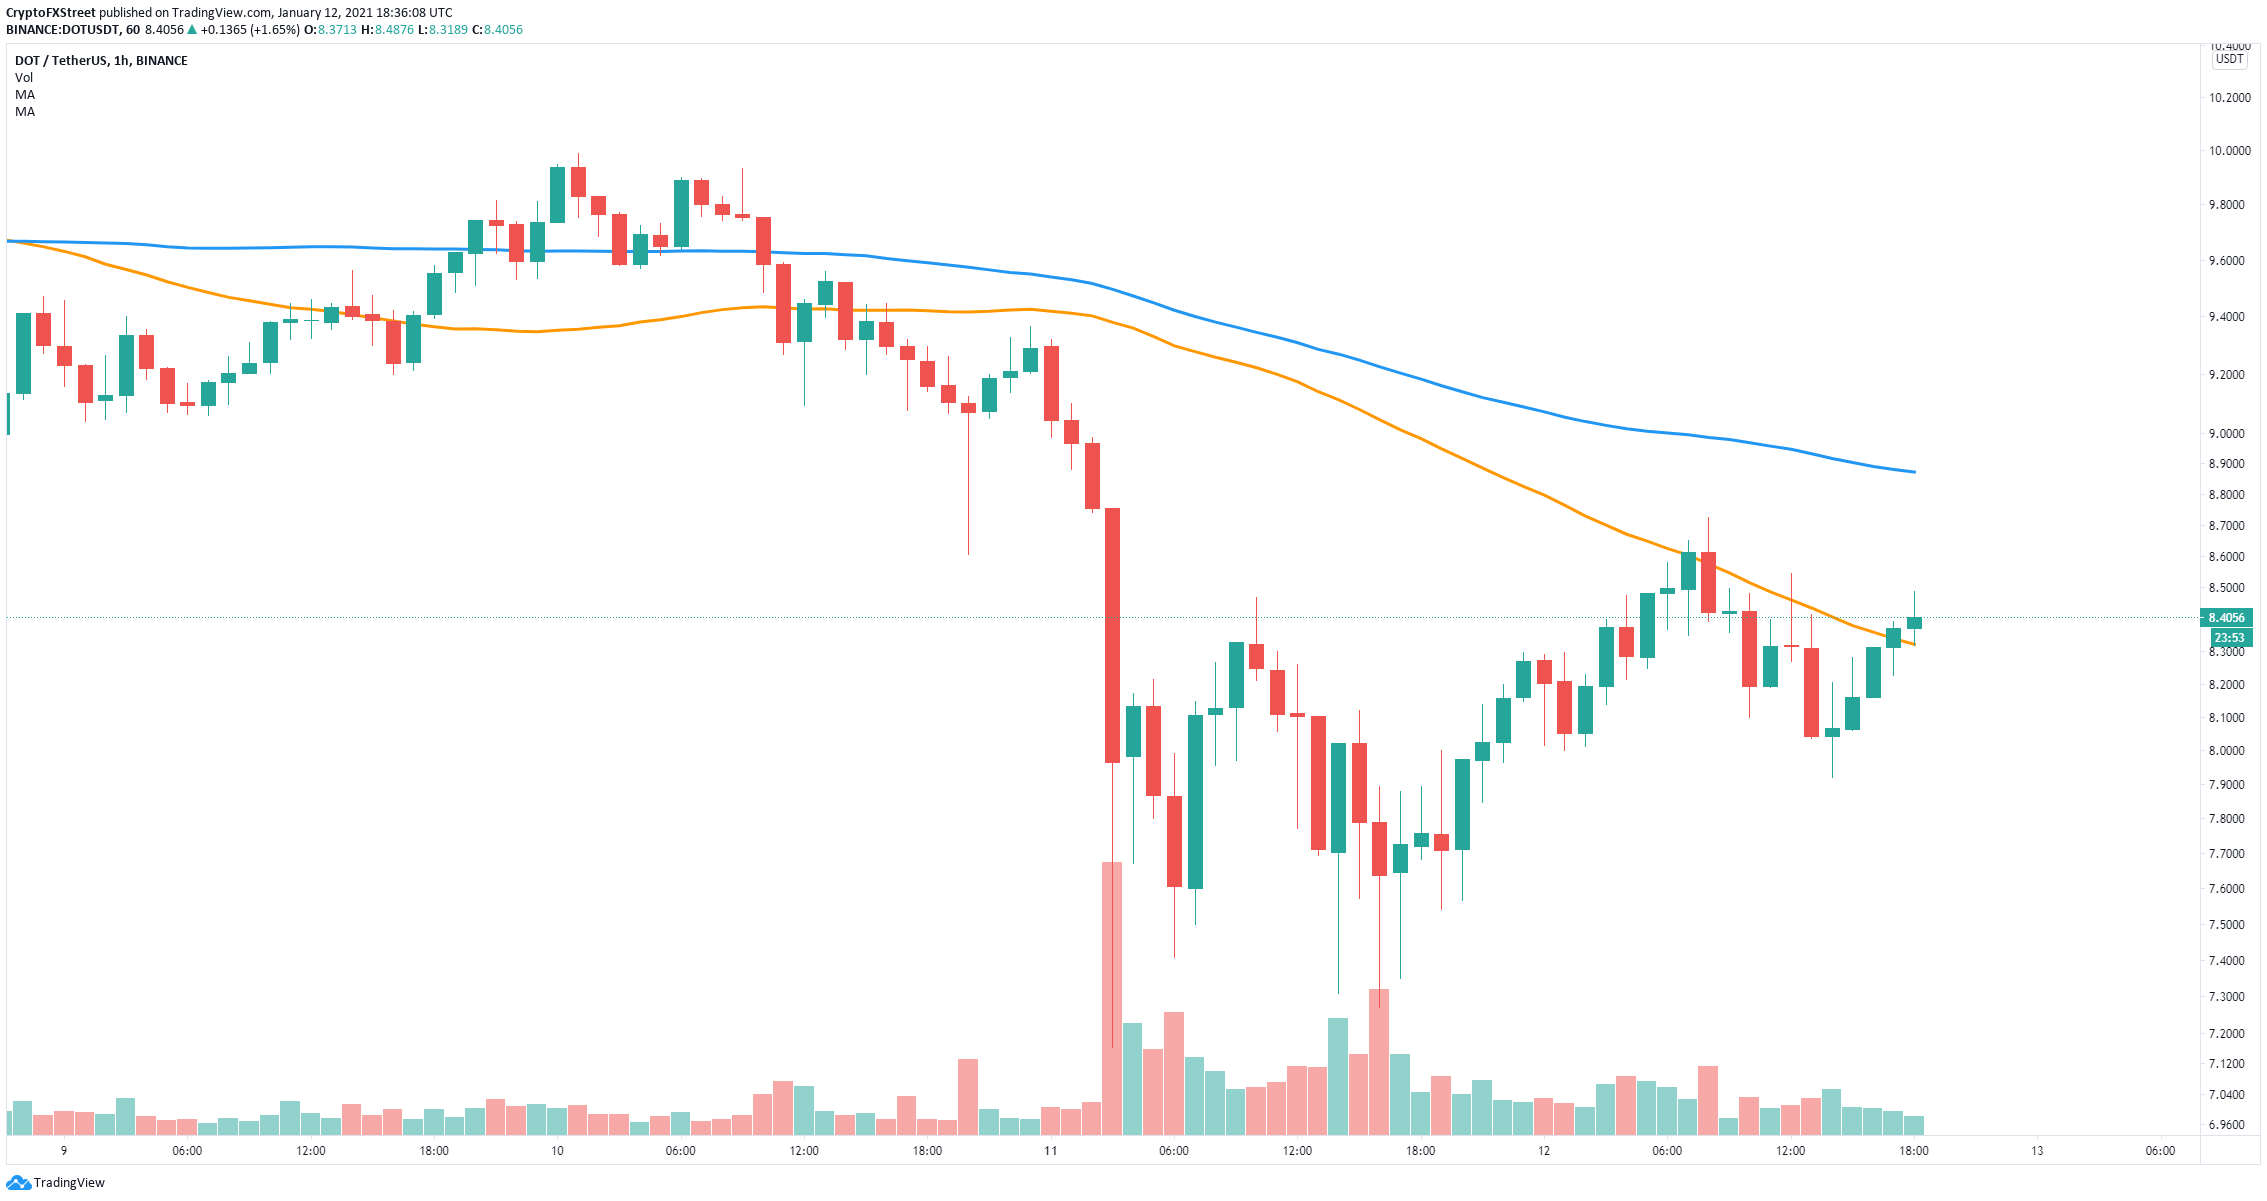
DOT/USD 1-hour chart
DOT is now facing a resistance level at $8.72, which is the last high, and $9 where the 100-SMA is currently located. Breaking out above these two levels can quickly drive Polkadot price towards $10 again.
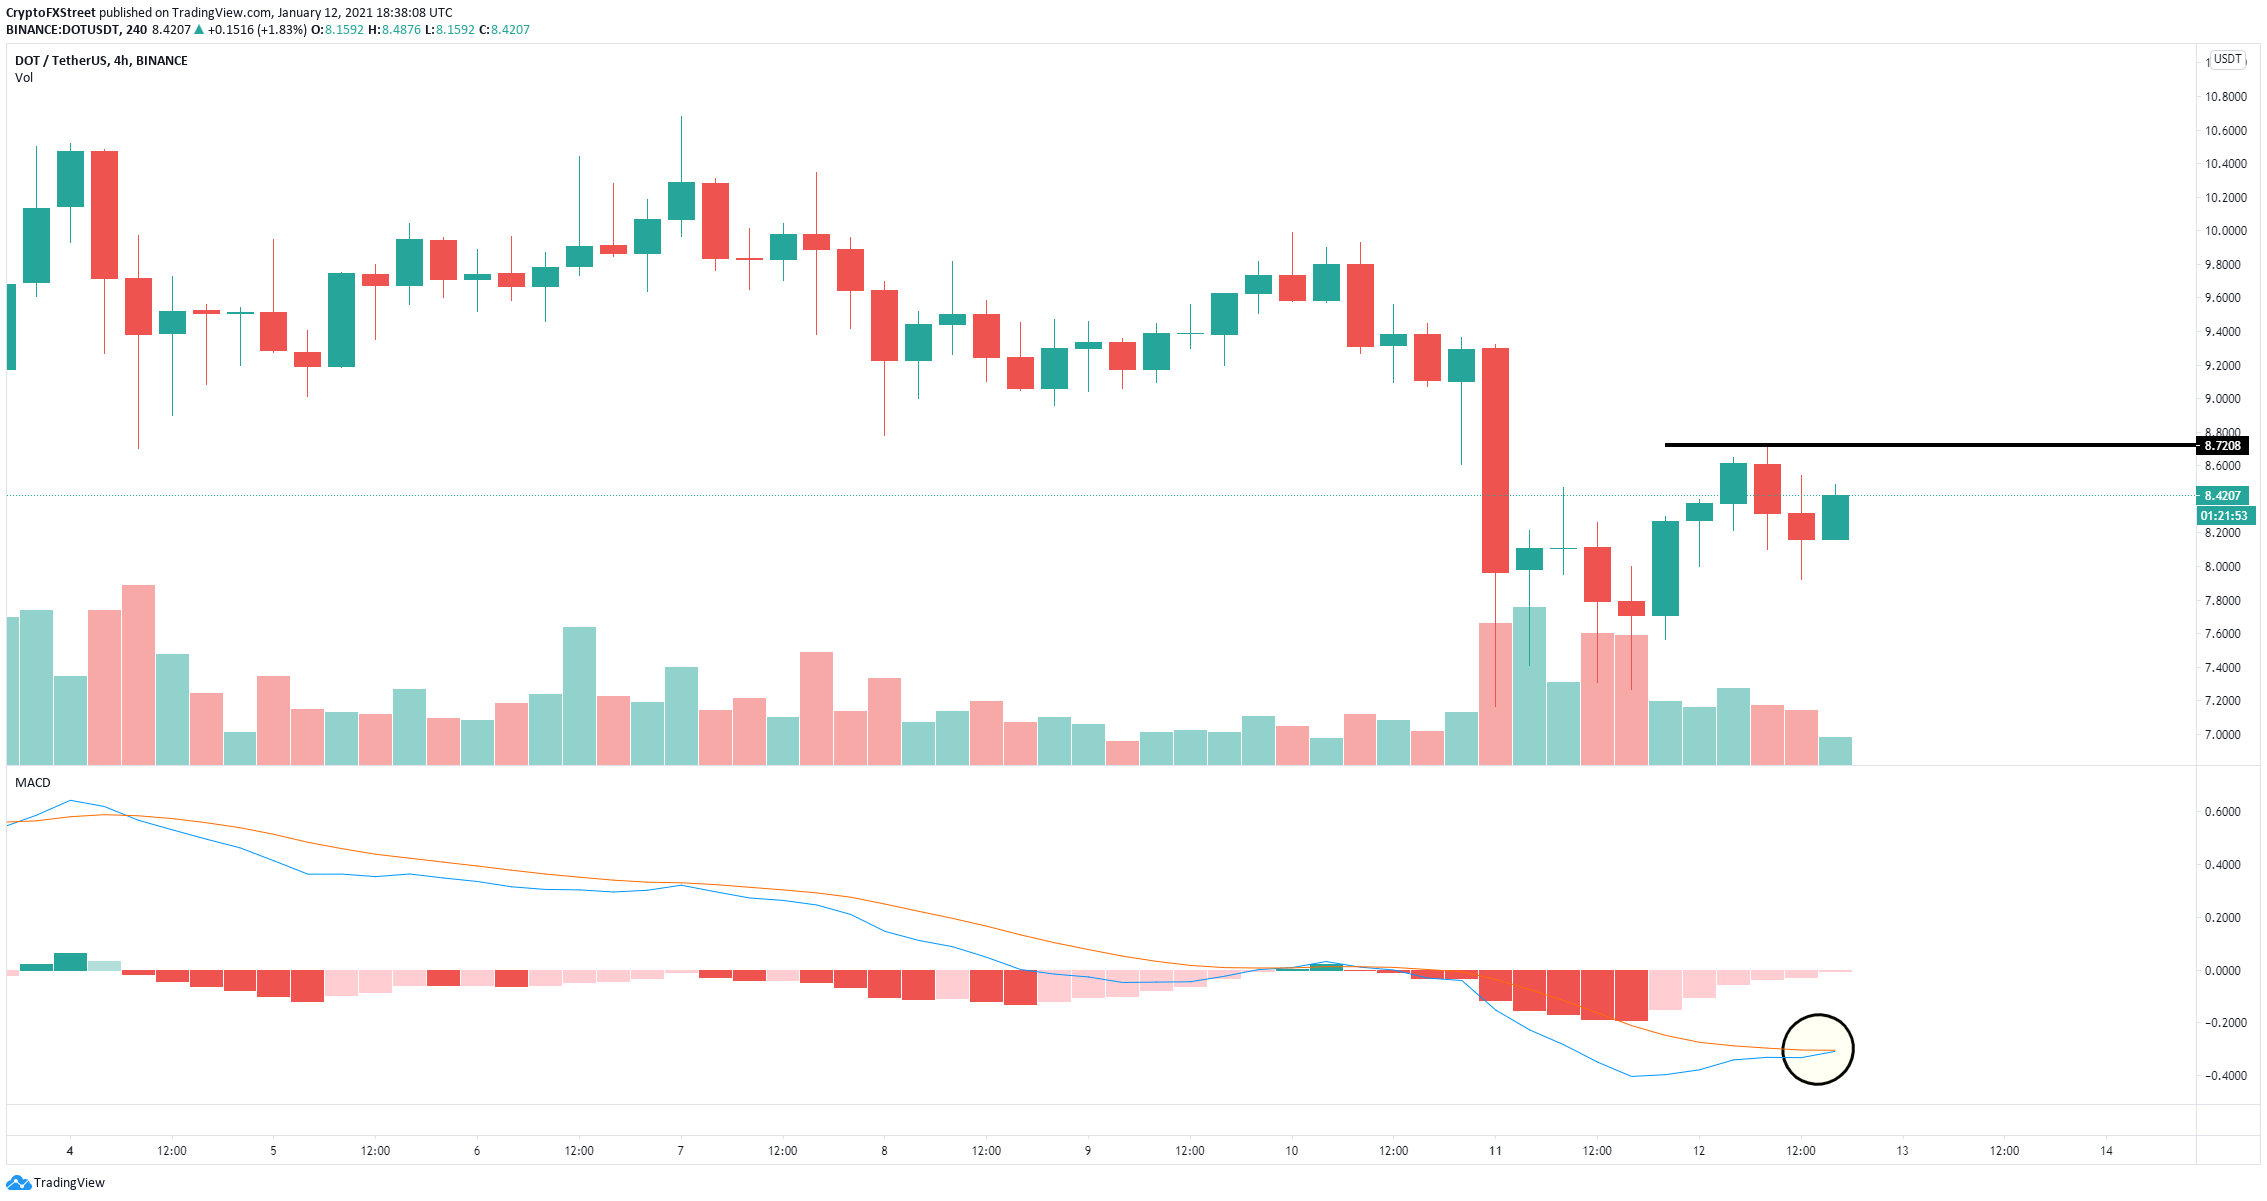
DOT/USD 4-hour chart
On the 4-hour chart, Polkadot has established a higher low at $7.9 compared to $7.16 and needs to climb above $8.72 to establish an uptrend. The MACD is on the verge of a bull cross for the first time since January 1 which adds credence to the bullish outlook.
However, a rejection from the high of $8.72 has the potential to create a small double top on the 4-hour chart and push Polkadot down to $7.16 again as there is very little support on the way down.
