- Polkadot price is bounded inside a symmetrical triangle pattern on the 4-hour chart.
- The digital asset is on the brink of a significant 25% breakout towards $44.
- DOT could continue to trade sideways for the next few days if there is no clear breakout.
Polkadot price has significantly rebounded from a low of $29.7 on February 28 but continues trading sideways inside a tightening pattern on the 4-hour chart. Bulls aim for a breakout above the critical resistance level at $35 while bears hope for another rejection.
Polkadot price needs to crack this key level
On the 4-hour chart, Polkadot has established a symmetrical triangle pattern and it’s on the verge of a breakout above the key resistance level at $35. Climbing above this point would lead Polkadot price towards $44, a 25% move calculated using the height of the pattern as a reference point.
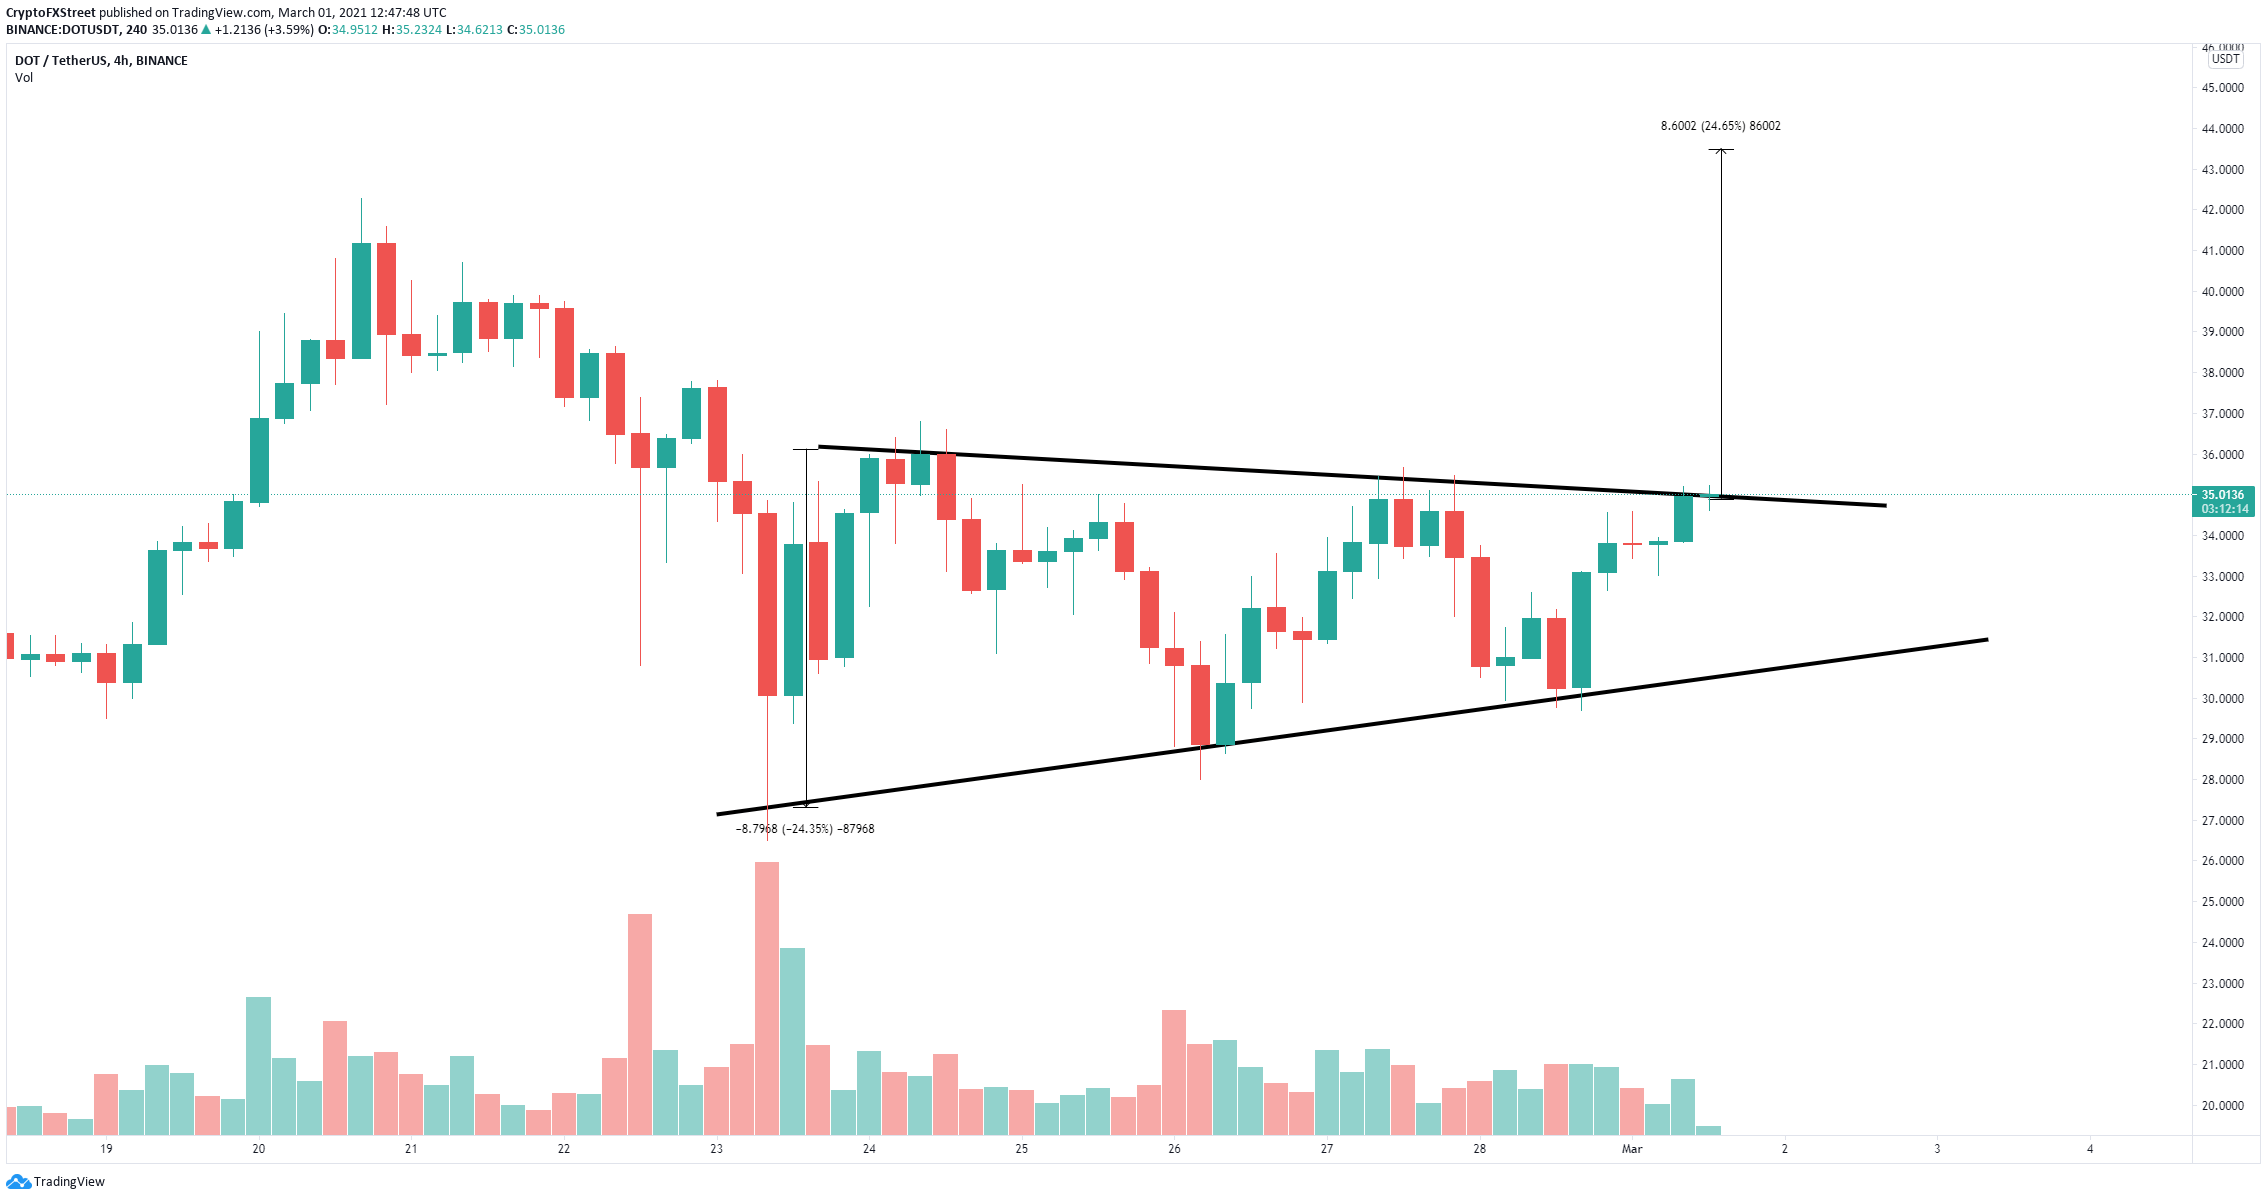
DOT/USD 4-hour chart
However, rejection from the key resistance level of $35 would be notably bearish and likely to drive Polkadot price down to the lower boundary of the pattern at $31.
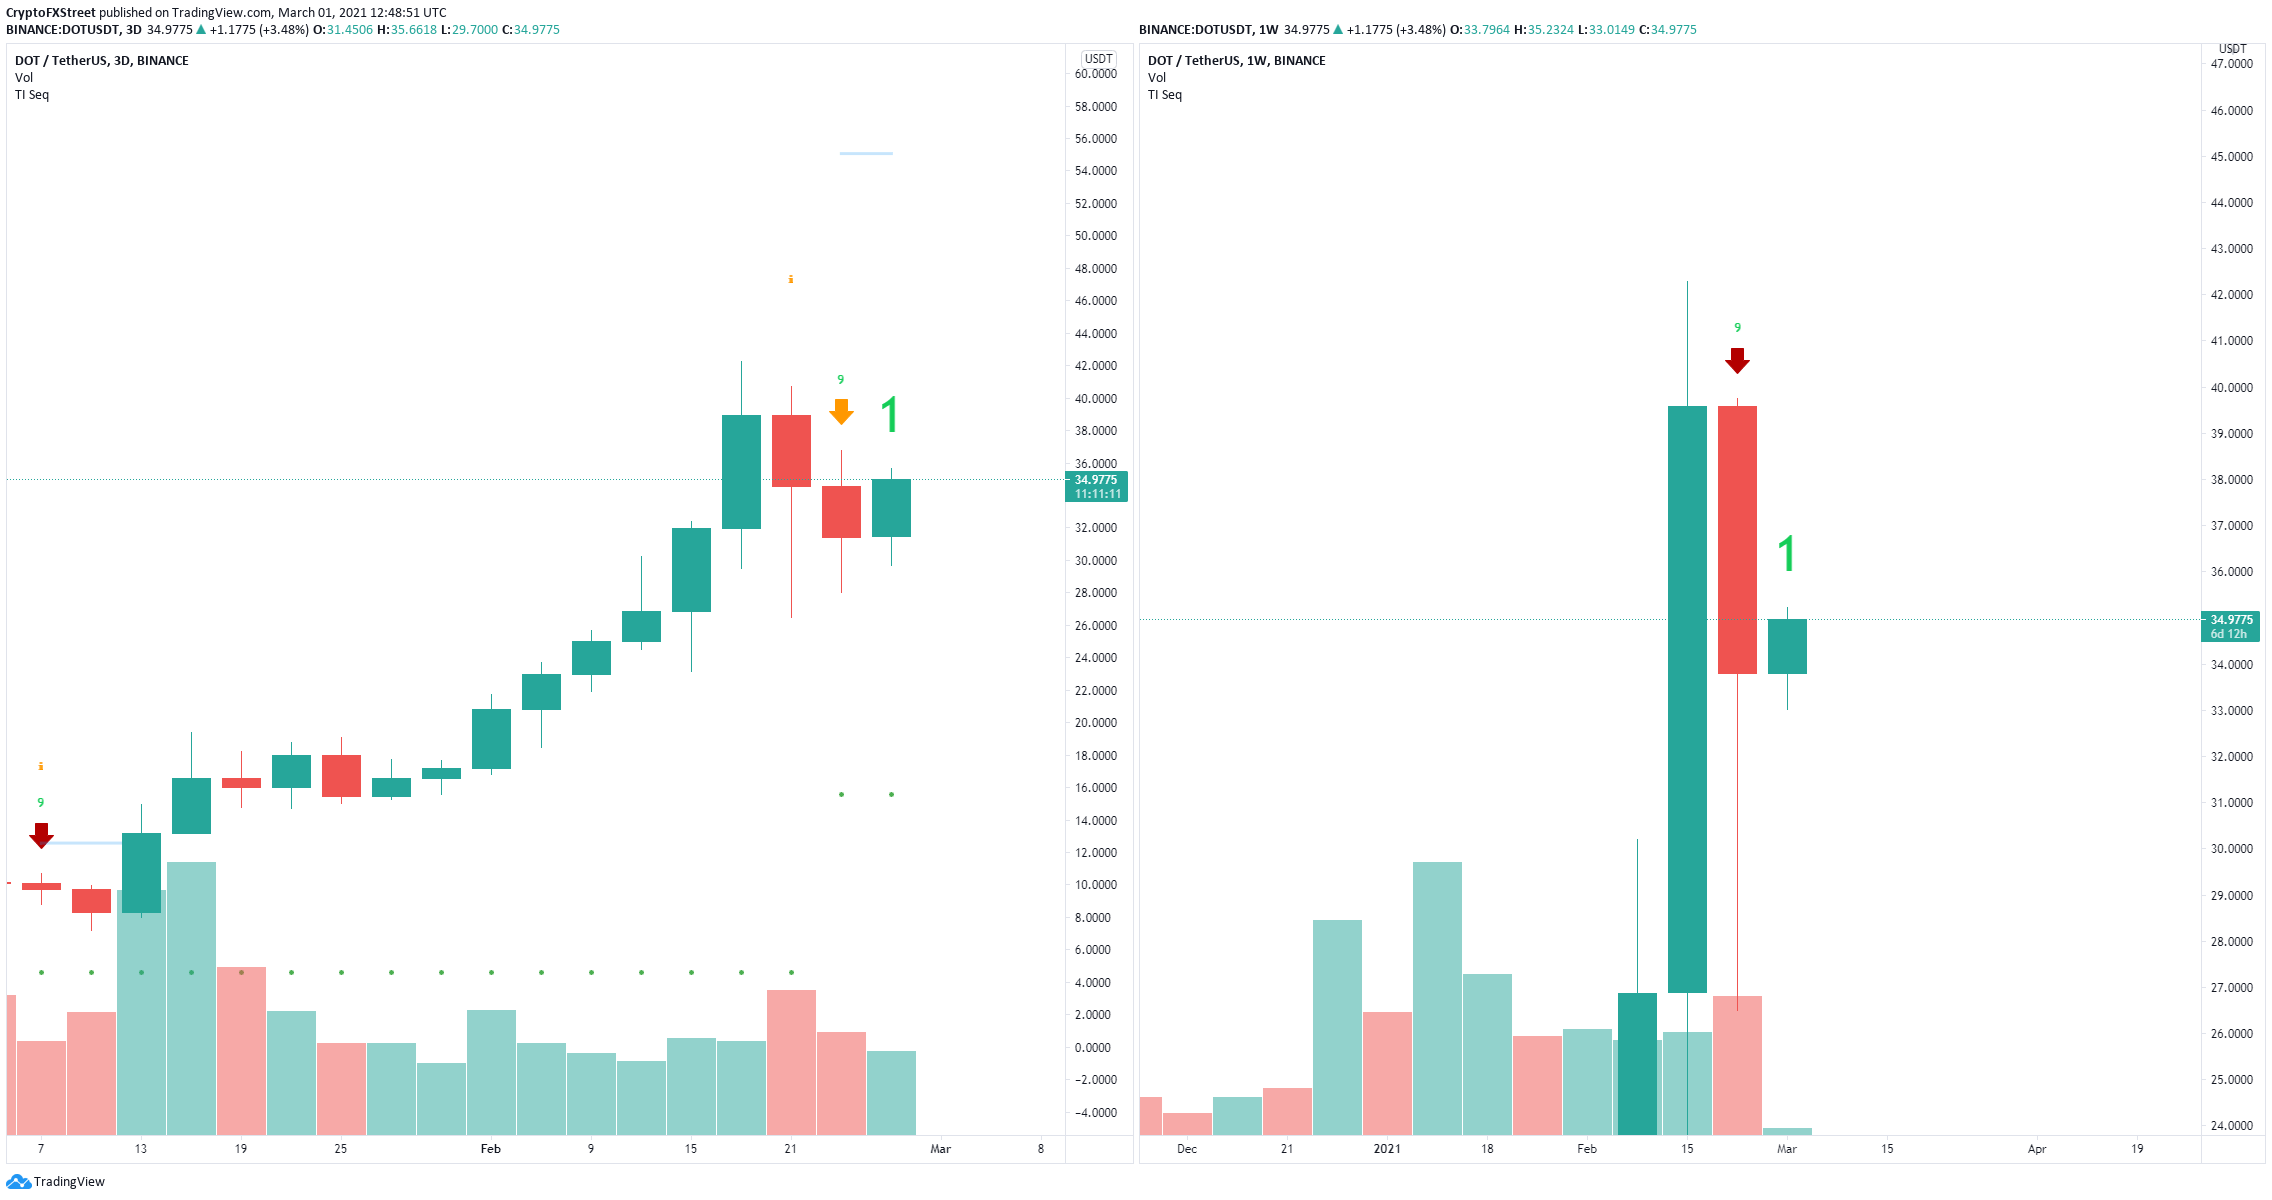
DOT Sell Signals
The TD Sequential indicator has presented sell signals on the 3-day and weekly charts, adding a lot of pressure to the bulls and credence to the bearish outlook.
