- RSR/USD has just hit a new all-time high at $0.0077 after a strong 17% price surge.
- The RSI is extremely overextended but trading volume keeps increasing.
Reserve Rights is up 63% in the last four days and seeing increasing bull volume. The daily RSI is touching 85. Clearly, a pullback is needed but it’s unclear when that will happen considering how strong the bull rally is.
RSR/USD daily chart
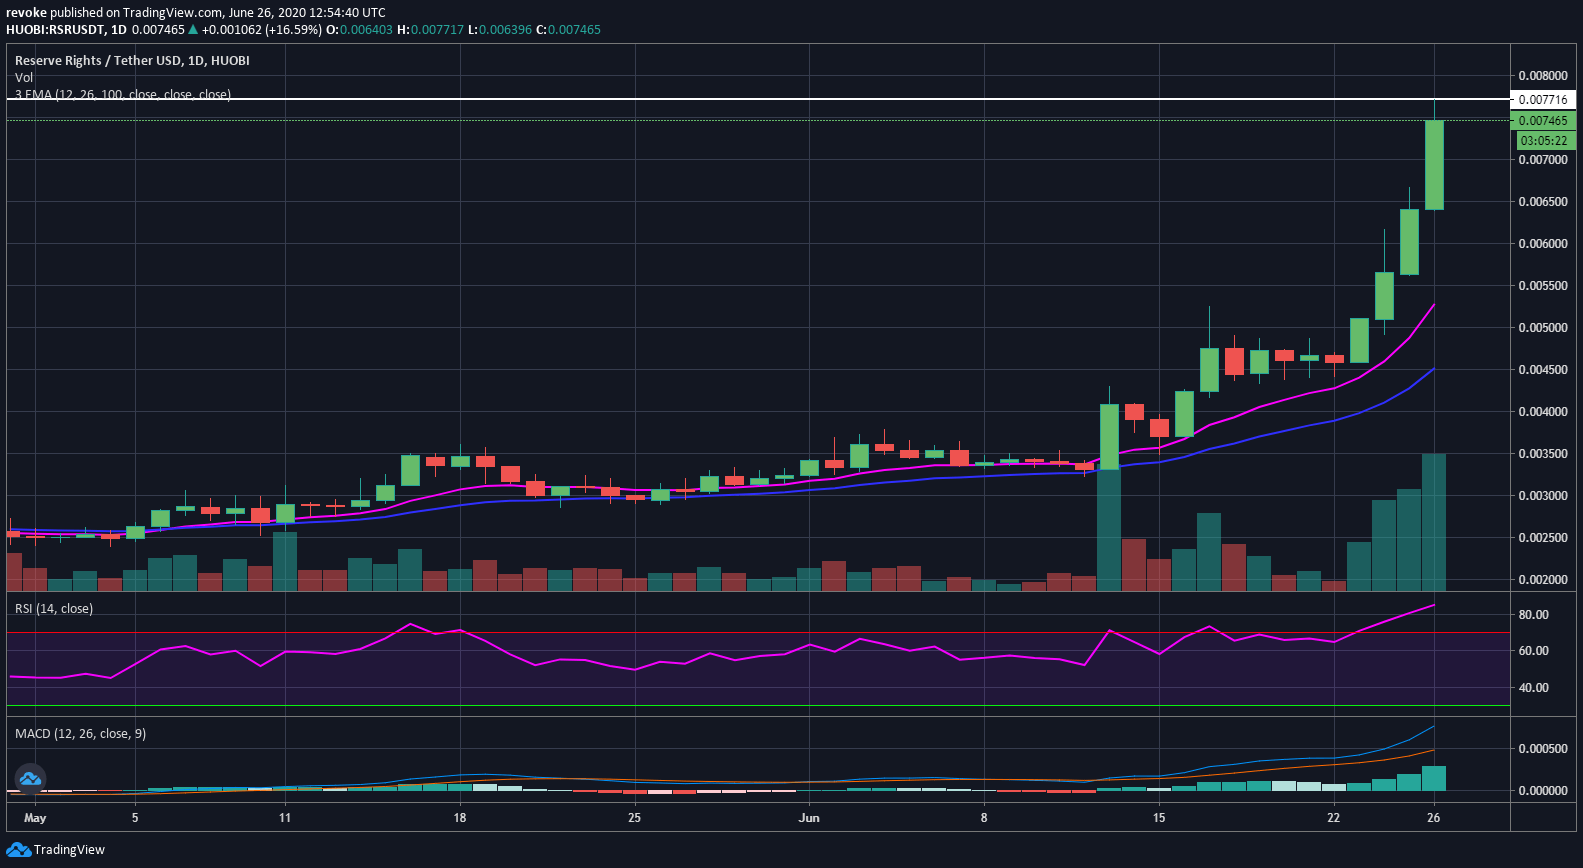
The daily uptrend is as strong as it can get with increasing bull volume and a super bullish MACD. The only resistance faced by the buyers is the overextended RSI. For now, anything above $0.0043 is a continuation of the daily uptrend. For closer support, RSR can use the daily 12-EMA currently located at $0.0052.
RSR/USD 4-hour chart
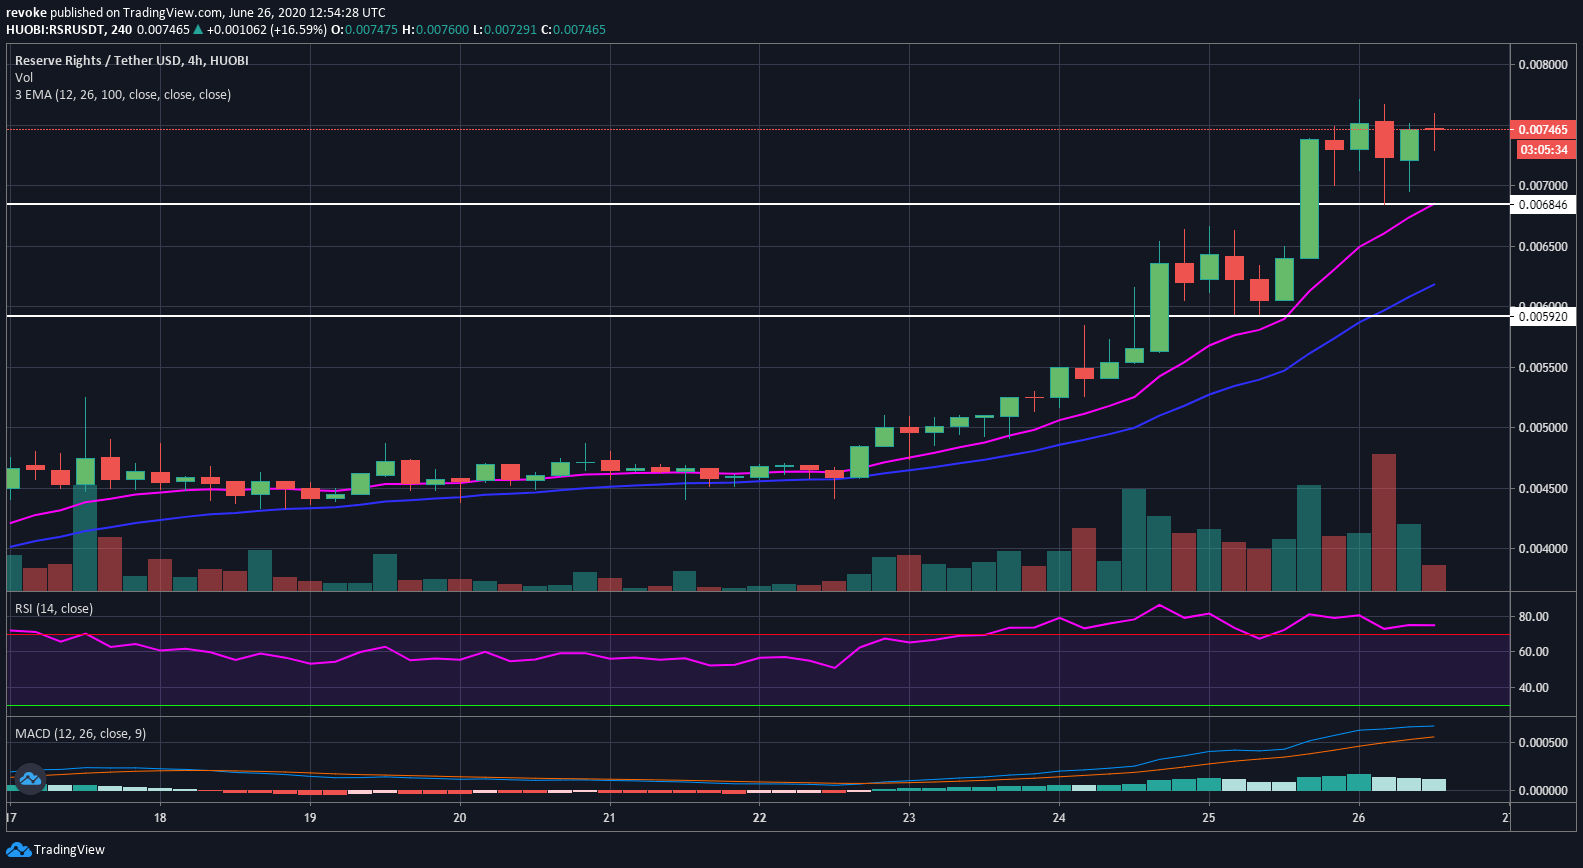
The 4-hour chart is healthier but the RSI is also overextended here. Bulls are looking to defend $0.0068 in the short-term and continue with the uptrend. The next support level is around $0.006.
