- Ripple resumes the decline after a failure at $0.3000.
- XRP/USD is moving within the short-term downside trend.
Ripple’s XRP peaked at $0.3041 on October 17 and retreated to $0.2890 by the time of writing. The third digital coin with the current market capitalization of $12.5 billion has lost nearly 5% of its value on a day-on-day basis, though it is still in the green zone on a day-on-day basis. The bulls failed to keep the price above the psychological $0.300 and lost the initiative to the short-term sellers.
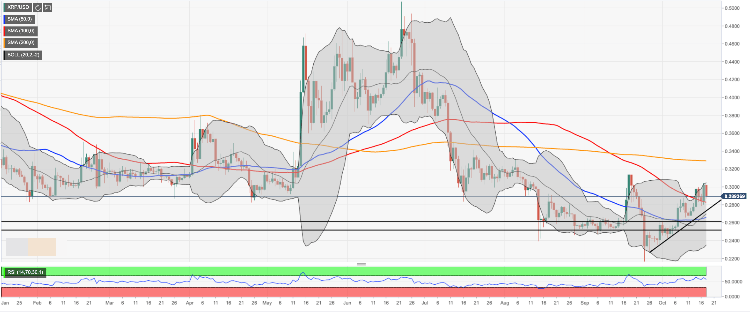
Looking technically, the price faced strong resistance at $0.3000, strengthened by the upper line of the Bollinger Band on a daily chart. While the coin is still above SMA100 (Simple Moving Average) on a daily chart, an increased bearish sentiment on the cryptocurrency creates a new bearish wave. A sustainable move below $0.2800 will worsen the technical picture and bring XRP to the upside trendline at $0.2730.
On the upside, we will need to see a sustainable move above $0.2900 to allow for another try at $0.3000 Once it is out of the way, the upside is likely to gain traction with the next long-term focus on $0.3300 with SMA200 daily located on approach. Notably, XRP/USD has been trading below this MA since July.
XRP/USD, daily chart