- XRP/USD gains 3% in recent 204 hours; the further upside is limited.
- Ripple’s coin is immune to speculations about JPM Coin effect.
XRP/USD hit $0.3184 during early Asian hours on Monday before retracing to $0.3100 by the time of writing. The third largest coin with the current market value of $12.8B has gained over 3% in recent 24 hours and 1.8% since the beginning of Monday.
The coin is moving in sync with the broader market as there are no Ripple-specific fundamental factors that might have triggered the upside movement. Considering the downward-looking RSI on the intraday charts, one may suggest that the downside correction is not over yet.
The strong support comes at $0.30. This psychological area is strengthened by SMA200 (4-hour), SMA100 and SMA200 (1-hour), and the upper line of 4-hour Bollinger Band located on approach. Once it is cleared a congestion zone of $0.2880 will come into focus.
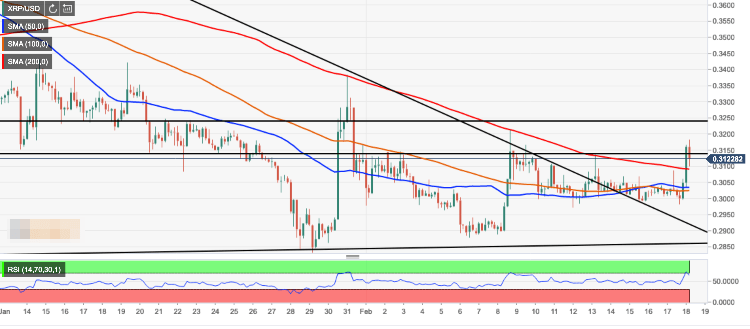
On the upside, the ultimate resistance is created by DMA50 at $0.3260. However, we will need to clear $0.3183 (Asian high) and psychological $0.3200 before we get there.
XRP seems to be immune to the speculations about the potentially damaging effect of JPM Coin issued by one of the largest financial institutions in the world. However, it may need a few positive triggers to gain momentum in this environment.
XRP/USD, 4-hour chart