- XRP/USD gains 5% in recent 24 hours; the momentum is waning.
- Ripple’s further recovery limited by $0.33-$0.3330 area.
XRP/USD hit $0.3334 during early Asian hours on Tuesday to trade at $0.3270 by the time of writing. The third largest coin with the current market value of $13.4B has gained over 5% in recent 24 hours and about 1% since the beginning of Tuesday.
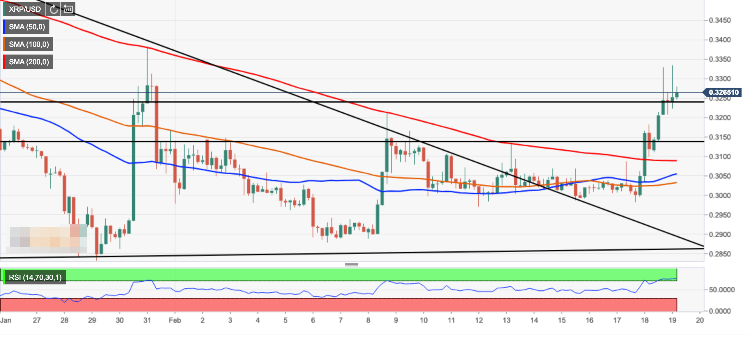
The coin managed to surpass DMA50 (currently at $0.3250) and settled above the long-term congestion zone $0.3180-$0.3200, which is a positive sign for XRP bulls. Now that the focus shifted to $0.3300, we cannot exclude a possibility of a stronger rebound towards $0.3500. Once the price moves above the recent high at $0.3334, there is little in terms of resistance levels that can hold it back from a strong ascend.
On the downside, the strong support is created by DMA50 and followed by psychological $0.31, strengthened by SMA200 (4-hour) located right below this handle. Once below, $0.3030-$0.30 congestion area will come into focus, while a move under $0.2890 (the broken downside trend line) will negate the bullish scenario.
XRP/USD, 4-hour chart