- XRP/USD lacks clear directional bias, awaits a range breakout.
- Ripple ranges between 100 and 200-DMA.
- Daily RSI has turned flat but stays below the midline.
Ripple (XRP/USD) is consolidating its rebound from multi-month lows, awaiting a strong catalyst for a range breakout.
A tug-of-war between the bulls and bears have left the no. 3 coin in limbo over the last two trading sessions. The price looks set to end the week within Friday’s range between $0.3703 and $0.2456.
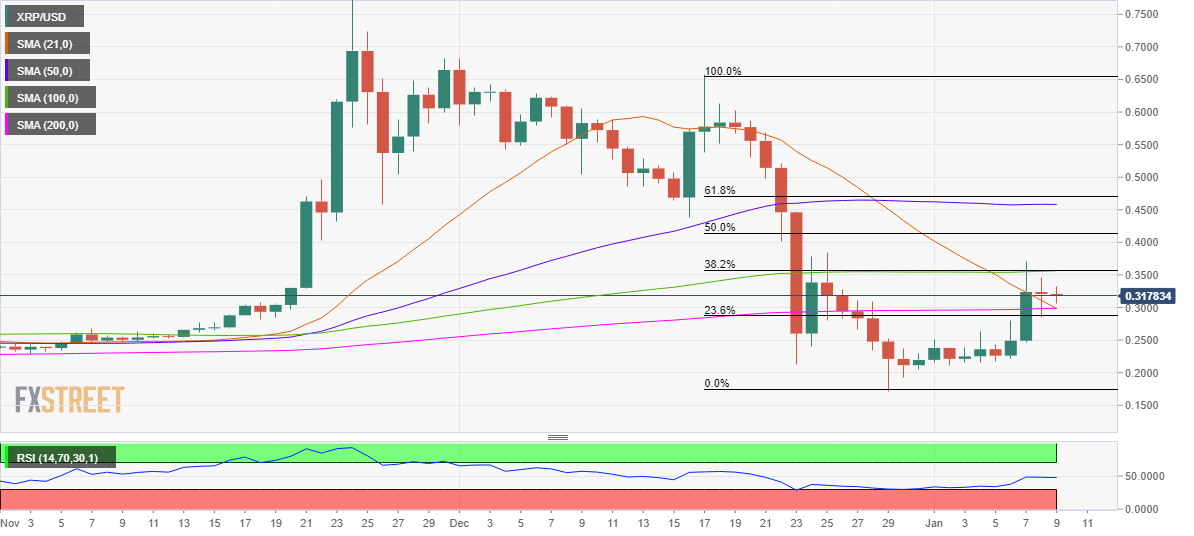
XRP/USD: Daily chart
Ripple’s daily chart shows a doji candlestick pattern for the second straight day, indicative of a likely buyers’ exhaustion.
The bulls need to take out the critical resistance at $0.3565 to extending the recovery momentum. That level is the meeting point of the horizontal 100-daily moving average (DMA) and 38.2% Fibonacci Retracement (Fib) of the decline from December 17 to December 29.
Acceptance above the latter could bring the 50% Fib of the same tumble at $0.4128 into play.
To the downside, the convergence of the bearish 21-DMA and horizontal 200-DMA at $0.2988 could offer strong support.
The 23.6% Fib at $0.2880 would be the last resort for the bulls.
The Relative Strength Index (RSI) trades flatlined, currently at 47.58, suggesting weakening upside bias.
XRP/USD: Additional levels to consider
