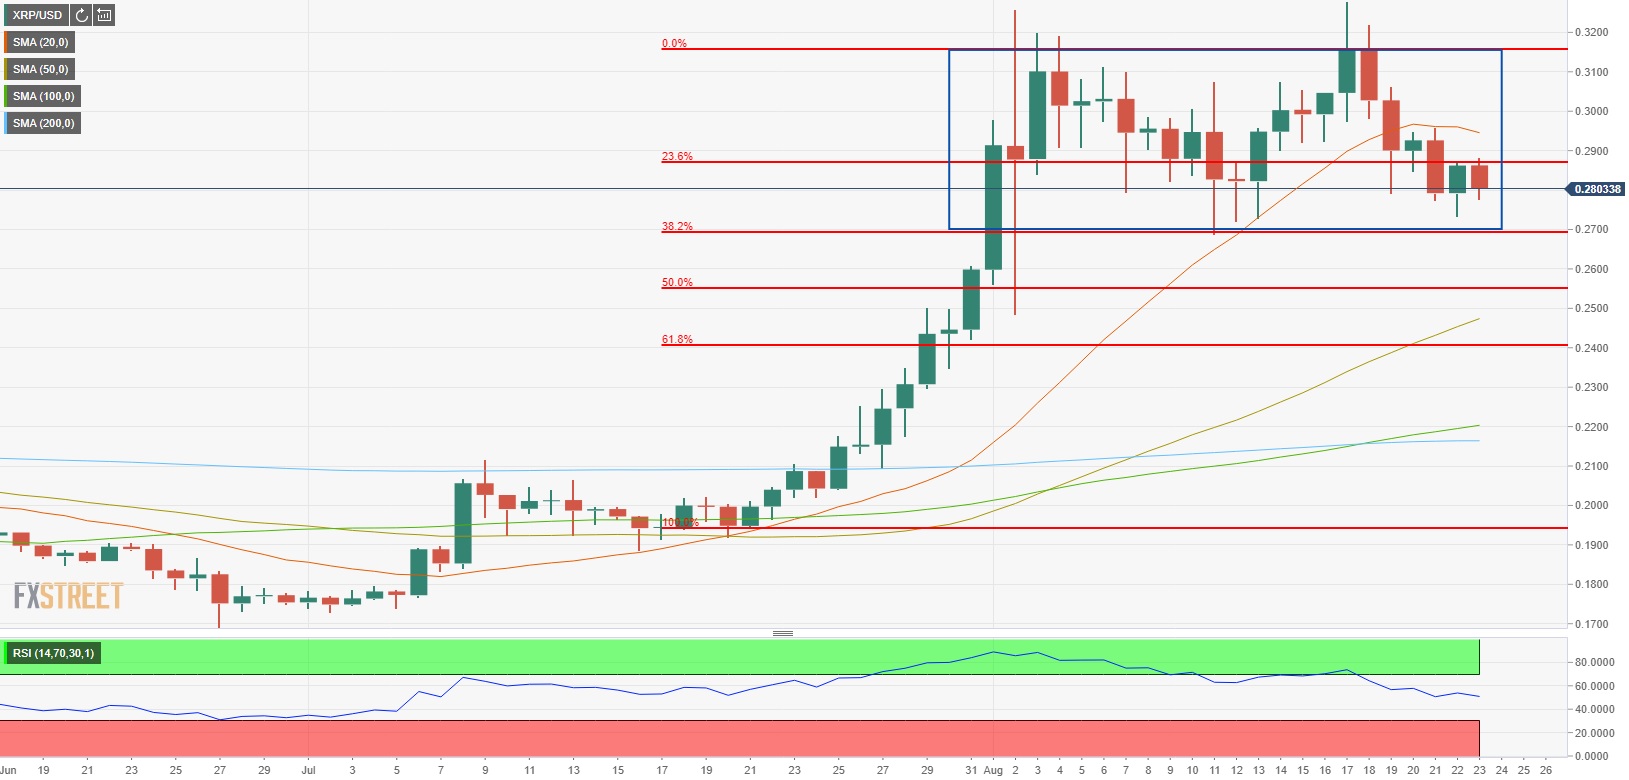
- Ripple is down nearly 8% for the week.
- Double top formation on the daily chart points out to a bearish reversal.
- A daily close below $0.2700 could open the door for further losses.
Ripple (XRP/USD) gained more than 2% on Saturday but failed to extend its rebound on Sunday. As of writing, XRP/USD was down 2% on the day at $0.2803 and was losing a little more than 8% since the beginning of the week.
Ripple technical outlook
On the daily chart, a double top formation has become apparent. The bottom line of this formation, which is seen as a bearish reversal sign, is located at $0.2700 (August 11 low, Fibonacci 38.2% retracement of June-August rally) and a daily close below that level could open the door for additional losses. $0.2530 (Fibonacci 50% retracement) and $0.2460 (50-day SMA) could be seen as the next targets on the downside.
Resistances, on the other hand, align at $0.2900 (20-day SMA, Fibonacci 23.6% retracement), $0.3000 (psychological level) and $0.3280 (August 17 high).

