- Visibility of a rising wedge break down on the short term charts.
- Risk of April lows hitting again, looms large.
Ripple bulls have a tough time defending therir turf as the short term chart points towards a breakdown and long term charts point towards April lows hitting again, whether it holds and bounces from there, is something only time can confirm.
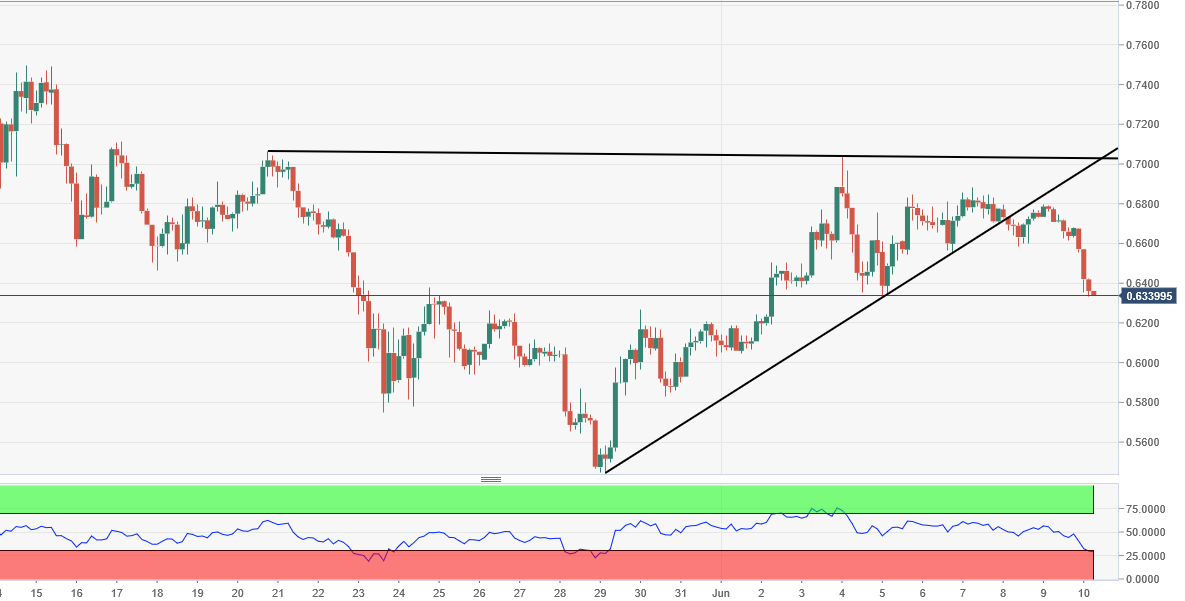
XRP/USD is down more than 3 percent on day at $0.6352, near the low point of the day. On the 180-minute chart, there is a clear visibility that the prices have broke down of a rising wedge pattern and now are headed lower than the May low of $0.54441.
On the daily chart too, the prices did not recover enough from the April lows and now after this breakdown, it could easily target April low of $0.458697, which would be a kissing distance from the May lows.
XRP/USD 180-minute chart: