- XRP/USD trims losses from the highest since May 2018, marked on Wednesday.
- Bears aren’t off the table as RSI, MACD flashes red signals for price strength.
- Key Fibonacci retracements can please the sellers during further downside, bulls may have to refresh the multi-month high.
XRP/USD battles short-term rising trend line while trying not to refresh the intraday low of 0.5803, currently down over 12% near 0.6050, during the early Thursday.
The crypto major surged to the highest since May 10, 2018, before stepping back the previous day. However, an upward sloping trend line from Sunday, currently around 0.5790, probes the bears.
However, RSI pullback from overbought conditions joins the first MACD bearish signals in over a week indicate further downside of the quote.
As a result, XRP/USD sellers await a downside break of 0.5790 for fresh entries while targeting the 61.8% Fibonacci retracement of November 18-24 upside, near 0.4730.
Meanwhile, an immediate descending trend line from Tuesday’s multi-month peak, at 0.7075 now, limits the quote’s short-term upside ahead of challenging the 0.7826 landmark flashed earlier in the week.
XRP/USD four-hour chart
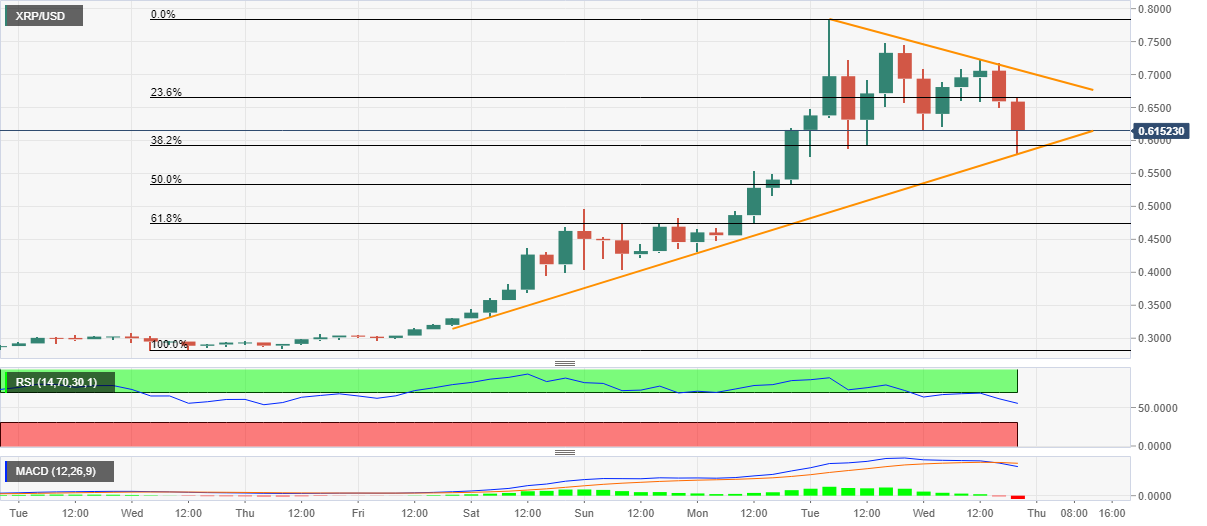
Trend: Further consolidation expected
