- XRP/USD trims the previous day’s losses, trying to snap two-week downtrend.
- Upbeat RSI, bullish MACD favors bull cross on the weekly chart to keep ripple buyers hopeful.
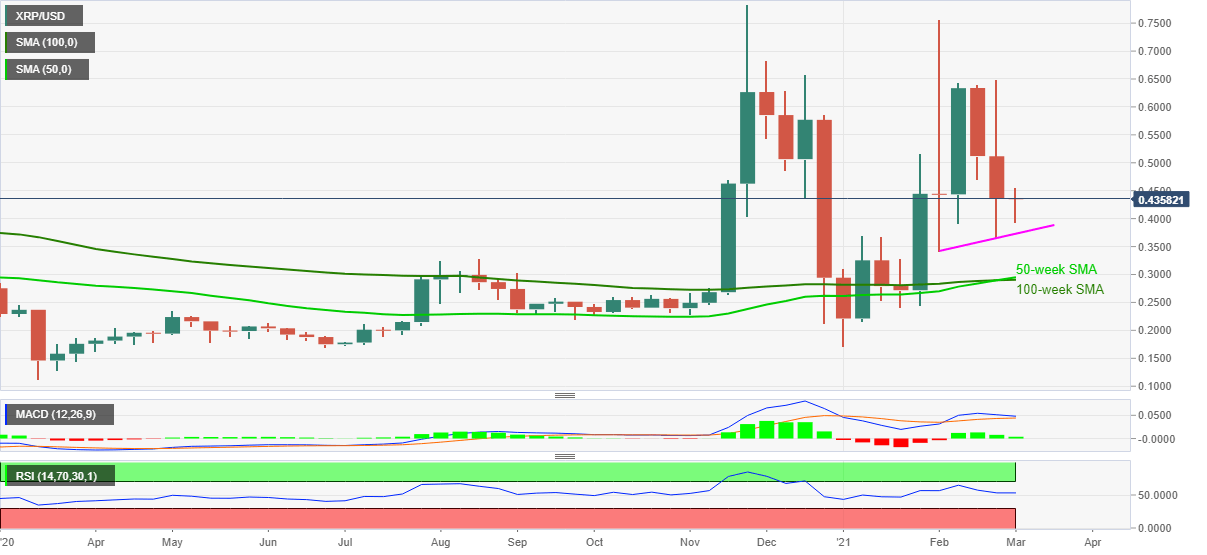
- $0.2900 will be the tough nut to crack for sellers during further downside.
XRP/USD picks up bids near $0.4350 while trying to reverse the previous day’s losses during early Wednesday. In doing so, the altcoin also stays indecisive after the two consecutive weeks of losses.
However, an upswing of 50-week SMA over 100-week SMA, known as a bull cross, backed by the upside RSI and MACD signals favor the ripple buyers.
As a result, the cryptocurrency pair’s run-up towards the $0.4700 and the $0.5000 threshold can be expected as short-term moves.
Though, the $0.6400 will be strong resistance for the XRP/USD bulls to crack before eyeing the fresh multi-month top above $0.7800.
Alternatively, a monthly support line near $0.3730 restricts the quote’s further downside ahead of highlighting 50-week and 100-week SMA levels, respectively around $0.2950 and $0.2900.
Overall, ripple is up for a fresh rally to the north given the fundamentals don’t flash any surprises.
XRP/USD weekly chart
Trend: Further upside expected
