- Ripple price is hovering below the 50-day SMA
- Squeezing Bollinger Bands point to market indecision
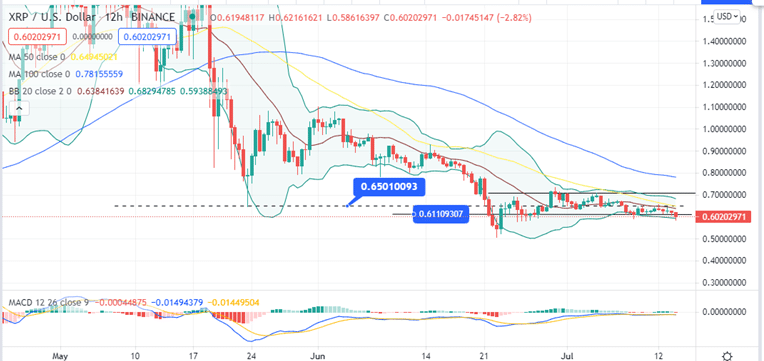
Ripple price has suffered under the strong arms of bears since the April 21 high of $1.97. This downswing has since flipped the 50-day, 100-day and 200-day Simple Moving Averages (SMA) from support to resistance. Since then, XRP has spent most of the time trading below the midline of the Bollinger Band (BB).
Ripple bulls have made numerous attempts to push the price higher, but the cross-border money transfer token has not made any remarkable progress towards the record highs.
Ripple Stuck between the 50-day SMA and Lower Boundary of the Bollinger Band
Ripple price volatility has been decreasing since June 29. This is validated as the Bollinger Bands squeeze towards each other, indicating market indecision. Since then, the XRP has been overing between the 50-day SMA resistance and the $0.611 support wall.
Meanwhile, XRP is currently changing hands around $0.602 on Binance as bulls struggle to hold above the BB’s midline. Note that the closure of the 12-hour candlestick above this zone will overturn the bearish grip as gains stretch towards the 50-day SMA.
If this happens, Ripple price bulls will try to overcome the powerful resistance at $0.65. However, any further movement upwards might be delayed by the resistance around the $0.70 zone. It is important to note that the narrowing of the Bollinger Bands is an indication of market consolidation. This means that any pressure from the bulls might be met by equal bearish pressure forcing XRP to remain below the 50-day SMA.
Ripple Price (XRP/USD) 12-Hour Chart
The MACD Indicator Confirms the Sideways Price Action
A technical outlook from the Moving Average Convergence Divergence (MACD) indicator validates XRP price consolidation. The horizontal movement of the MACD shows that bulls and bears are canceling each other out. It also confirms the bearish outlook by its position below the zero line. Note that the continuation of the bearish run will be validated if the MACD sell crypto signal. This call to sell occurs once the MACD line (blue) crosses the below signal line (orange) and moves further into the negative zone.
On the flip-side, if bulls are able to push the Ripple price above the recent $0.611 support, any further declines to the June 22 low at $0.5 can be derailed. This will happen if the Moving Average Convergence Divergence (MACD) crosses and continues moving above the signal line into the positive region. This will significantly boost Ripple price upwards as bulls target $0.7.
If you are new to crypto, our beginners’ guide on how to buy cryptocurrency might be useful.
Looking to buy or trade Ripple now? Invest at eToro!
Capital at risk
