- XRP/USD went down from $0.255 to $0.254 in the early hours of Thursday.
- The moving average convergence/divergence (MACD) indicator shows decreasing bullish momentum.
Ripple is on course of charting its fourth bearish day in a row. So far, XRP/USD has gone down from $0.255 to $0.254 in the early hours of Thursday. Over the last four days, Ripple has fallen from $0.263 to $0.254. The hourly breakdown of Wednesday shows us that the price had dropped from $0.252, where the bulls made a comeback and took XRP/USD back up to $0.255. Since then, the bears re-entered the market and have taken the price down to $0.254.
XRP/USD daily chart
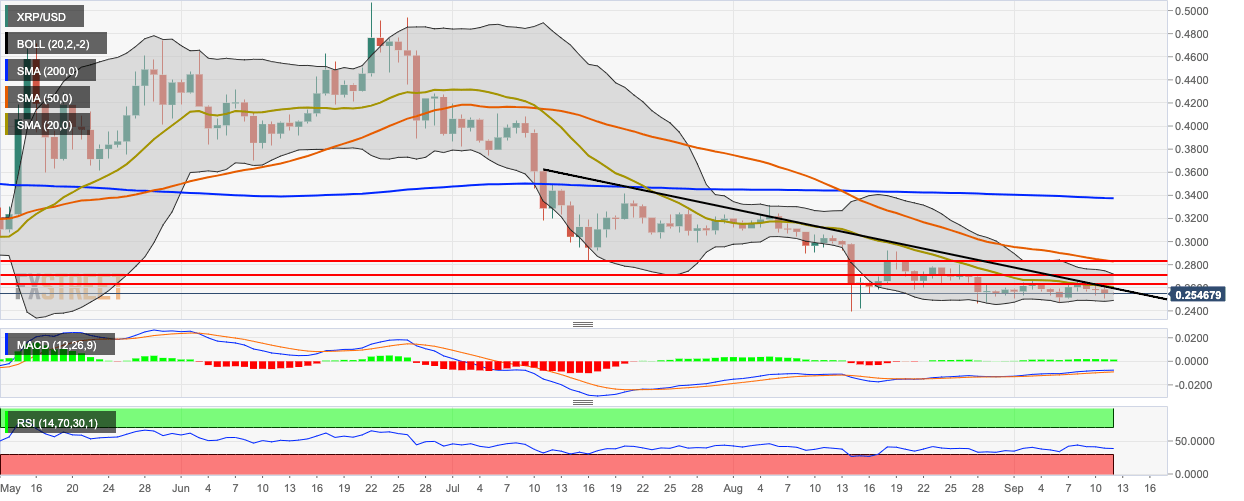
XRP/USD has found resistance on the downward trending line and the 20-day simple moving average (SMA 20) curve and is trending below the SMA 200 and SMA 50 curves. The 20-day Bollinger jaw is narrowing, indicating decreasing market volatility. The moving average convergence/divergence (MACD) indicator shows decreasing bullish momentum. The relative strength index (RSI) indicator is trending around 39.
