- XRP/USD bulls cleared $0.2000, but the upside momentum stalled
- Strong support is created at $0.1900, which is the lowest level of the previous consolidation channel.
XRP price stays marginally above $0,2000 after a successful attempt to clear this pivotal barrier. The third-largest digital coin hit the intraday low at $0,1970 before fresh buying interest pushed the price back above $0,200. XRP/USD has stayed mostly unchanged on a day-to-day basis and lost nearly 2% since the beginning of Friday.
The intraday chart shows that the RSI stays flat with a mild bullish bias. It means that the coin may continue moving in a tight range above $0.2000.
XRP/USD 1-hour chart
-637251319467456363.png)
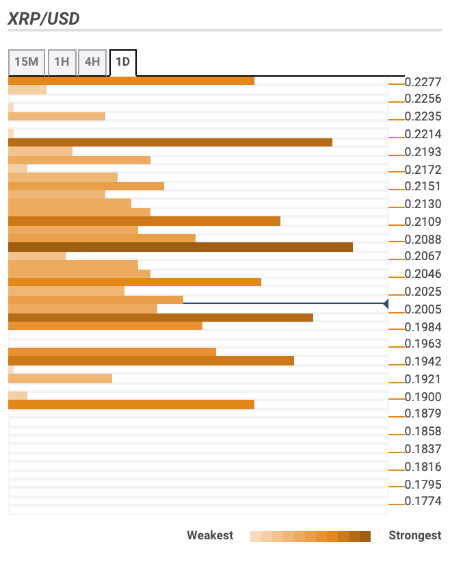
Let’s have a closer look at support and resistance levels clustered around the current price.
Resistance levels
$0,2080 – the upper line of the 4-hour Bollinger Band, the lowest level of the previous week, daily SMA10
$0,2110 – Pivot point 1 day Resistance 1, 38.2% Fibo retracement monthly
$0,2200 – 61.8% Fibo retracement weekly, 23.6% Fibo retracement monthly
Support levels
$0,2000 – 1-hour SMA100, 4-hour SMA5, the lowest level of the previous day
$0,1950 – 61.8% Fibo retracement monthly, 161.8% Fibo projection daily
$0,1900 – Pivot Point 1-week Support 3, the lower line of the daily Bollinger Band