- Exchanges in India are slowly coming to terms with the chance that they might not be able to access banking services.
- The Bears are not done in spite of the extended declines.
- At the moment, the path of least resistance is to the downside.
The cryptocurrency market is nothing but a high-speed roller coaster ride. The market survived the hack attack on Bithumb exchange. In fact, prices embarked on a brief uptrend with Ripple price trading marginally above $0.56. Since Monday this week, XRP/USD has kept above $0.52, however, the market turned red on Friday morning during the Asian trading hours and continued into the European hours.
The exchanges in India are slowly coming to terms with the chance that they might not be able to access banking services if the court does not lift the directive sent to banks in the country by the Reserve Bank of India (RBI) before the beginning on July. India’s Zebpay exchange today sent a reminder to its customers concerning the directive and the market reaction has sent prices to rock-bottom.
In other news, the Financial Services Agency (FSA) in Japan ordered six exchanges in the country to improve their businesses, particularly the measures taken to fight against money laundering. The exchanges have been given until June 23 to submit new plans to the regulator. This situation has also sent jitters in an already volatile market.
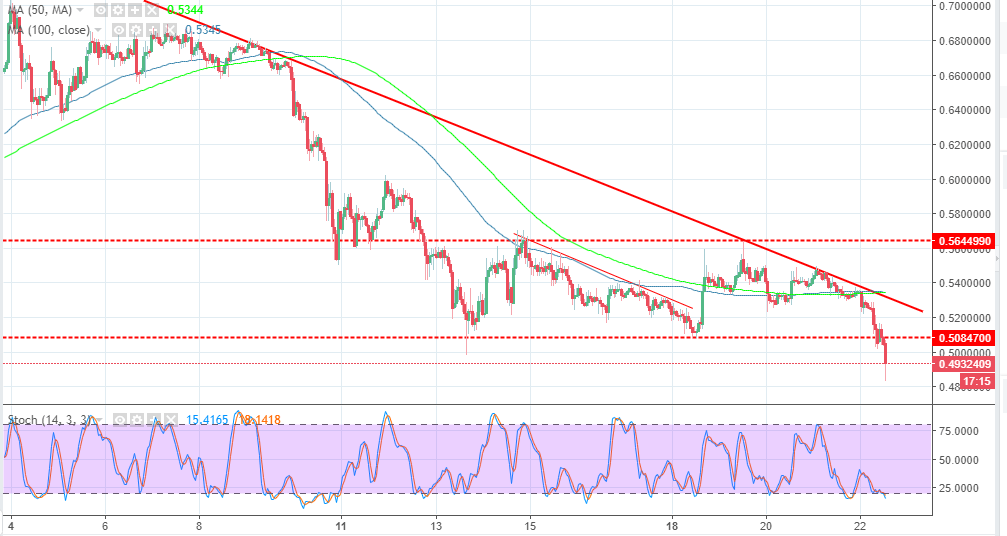
Ripple price technical picture
The cryptocurrency, which is ranked the 3rd by market capitalization, has sustained huge declines that it has broken below the ranging channel explored in the analysis on Thursday. The Bears are not done in spite of the extended declines. Moreover, technical indicators like the stochastic are in the oversold, but the sellers still ignore it. XRP/USD is exchanging hands slightly below $0.50. The 100 SMA has crossed to the upper side of the short-term 100 SMA indicating that the selling activity is high at the moment and will continue in the near-term. At the moment, the path of least resistance is to the downside, but in case of a trend reversal, the buyers will encounter resistance at $0.50 and $0.54 levels respectively.
XRP/USD 15′ chart