- XRP/USD is hovering above the green Ichimoku cloud.
- The SMA 50 is on course to cross over the SMA 200 curve.
XRP/USD daily chart
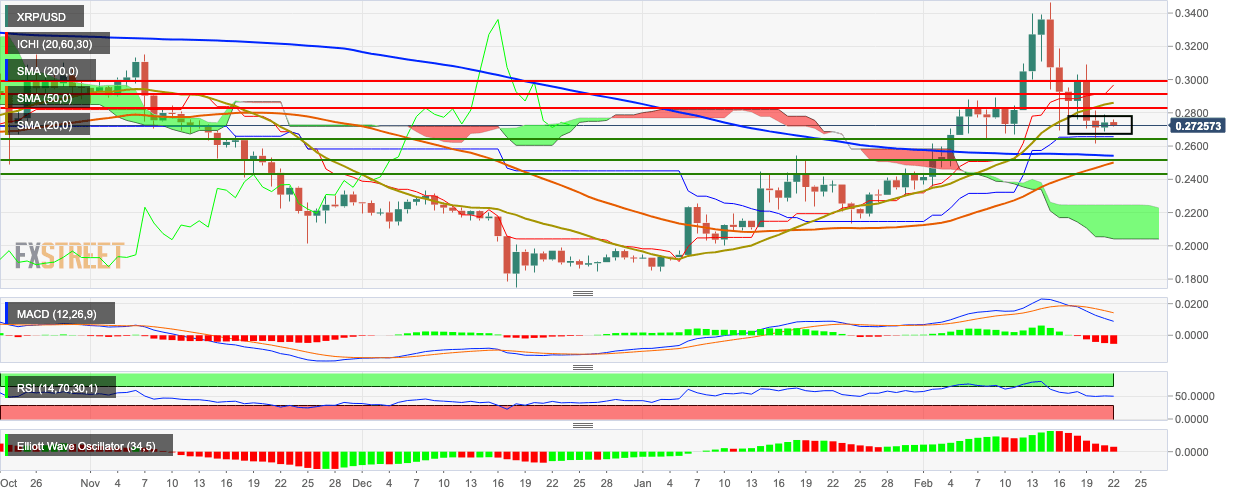
XRP/USD dropped from $0.2745 to $0.273 as the price continued to consolidate in a flag formation and settle below the $0.275-level. XRP/USD is still hovering above the green Ichimoku cloud, while the SMA 20 is trending above the price. The MACD and Elliott Oscillator both indicate sustained bearish market sentiment, while the RSI is trending around the neutral zone. Interestingly, the SMA 50 is about to crossover the SMA 200, which could trigger massive bullish action in the near future.
