- The daily price chart is trending below the SMA 20, SMA 50 and SMA 200 curves.
- The price is hovering above the green Ichimoku cloud.
XRP/USD daily chart
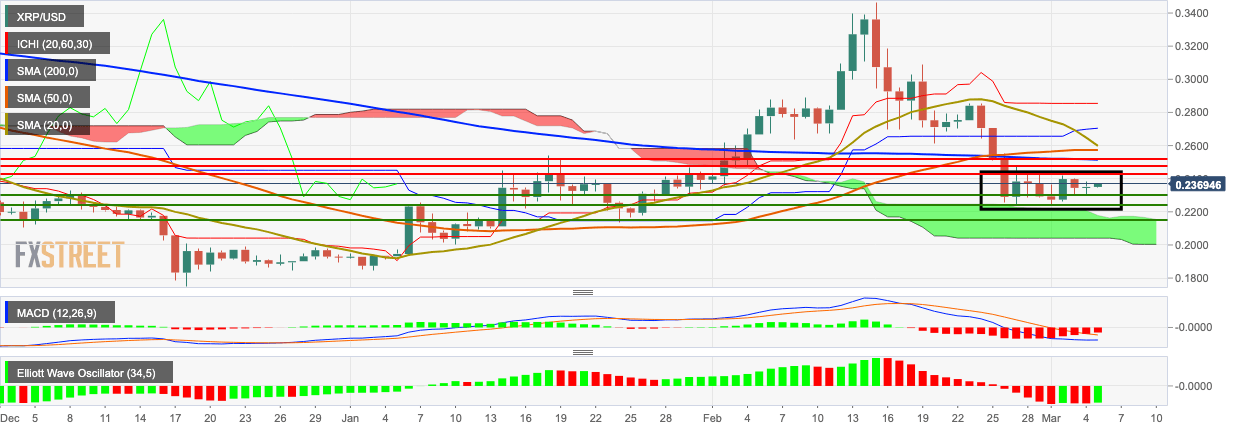
XRP/USD went up from $0.2352 to $0.2366 in the early hours of Thursday. The price has been trending in a narrow $0.012-range between $0.227 and $0.239 over the last eight days. XRP/USD is sandwiched between the green Ichimoku cloud on the downside and the SMA 20, SMA 50 and SMA 200 curves on the upside. The MACD indicates decreasing bearish momentum, while the Elliott Oscillator has had two green sessions out of the last four, showing bullish fightback.
