- Ripple’s technical picture is strongly negative in the short-term.
- The symmetrical triangle breakout could boost XRP upwards and assist in conquering the stubborn resistance at $0.28.
The price action across the market has been mostly mundane. The gains accrued over the weekend and on Monday failed to hold as bearish pressure took center stage yesterday. Ripple, for instance, continues to thin towards the key support at $0.26. The immediate upside capped by both the 50 Simple Moving Average 1-hour and the 100 SMA 1-hour.
The increasing divergence of the 100 SMA below the shorter term 50 SMA hints progressing bear action. Besides the moving averages upside movements are hindered at $0.27 resistance. The previous break above this level on Monday stalled short of $0.28.
Ripple’s technical picture is strongly negative. The Relative Strength Index (RSI) has been unable to rise above the average today. The indicator is sloping gradually downwards signaling a bear trend gaining traction. Similarly, the Moving Average Convergence Divergence (MACD) is stuck on the negative side of the mean line (0.000). The bearish divergence stamps down on the bear pressure currently dominating the crypto space.
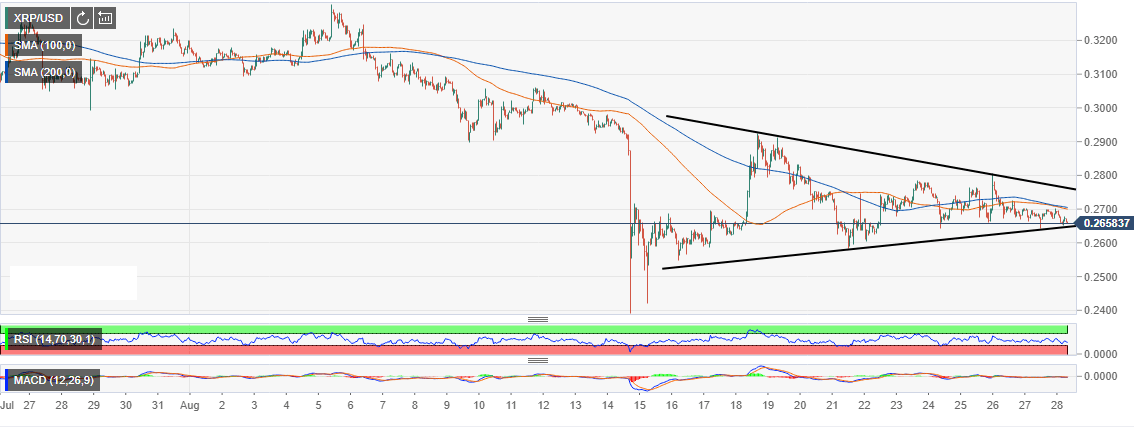
On the brighter side, a possible symmetrical triangle breakout could boost XRP upwards and assist in conquering the stubborn resistance at $0.28. The kick above $0.30 will be remarkable for the third-largest crypto on the market.
XRP/USD 1-hour chart