- Ripple’s coin has retreated from the recent high, short-term trend remains bullish
- The critical trendline support is located at $0.2550.
Ripple’s XRP, the third-largest digital asset with the current market capitalization of $11.1 billion, has retreated from the recent high of $0.2618 and settled below $0.2600 handle during early Asian hours. While XRP/USD is unchanged both on a day-on-day basis and since the beginning of the day, the short-term bullish sentiments imply that the coin is vulnerable to further losses. At the time of writing, XRP/USD is changing hands at $0.2570.
Technical picture
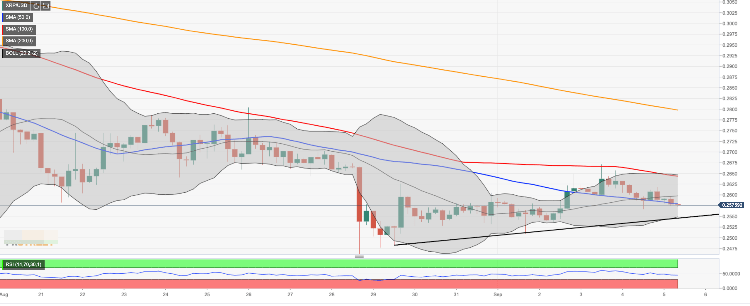
XRP/USD has been moving in a tight range with mildly bullish bias since August 29. The coin attempted to break above $0.2600 barrier, but the upside momentum proved to be unsustainable as the price retreated back inside the previous range. Now the strong support is created at $0.2550 by a confluence of the lower line of 4-hour Bollinger Band and an upside trendline from August 29 low. Once it is cleared, the sell-off may continue towards $0.2500. A sustainable move below this handle will open up the way towards August 14 of $0.2392 and psychological $0.2300.
On the upside, the initial resistance is created by $0.2600 with the middle line of 4-hour Bollinger Band located on approach; however, a stronger barrier awaits us at $0.2645, where SMA5100 (Simple Moving Average) 4-hour meets the upper line of 4-hour Bollinger Band.
XRP/USD, 4-hour chart