- XRP/USD fell from $0.196 to $0.193 this Monday.
- The MACD indicator shows decreasing bullish momentum.
XRP/USD daily chart
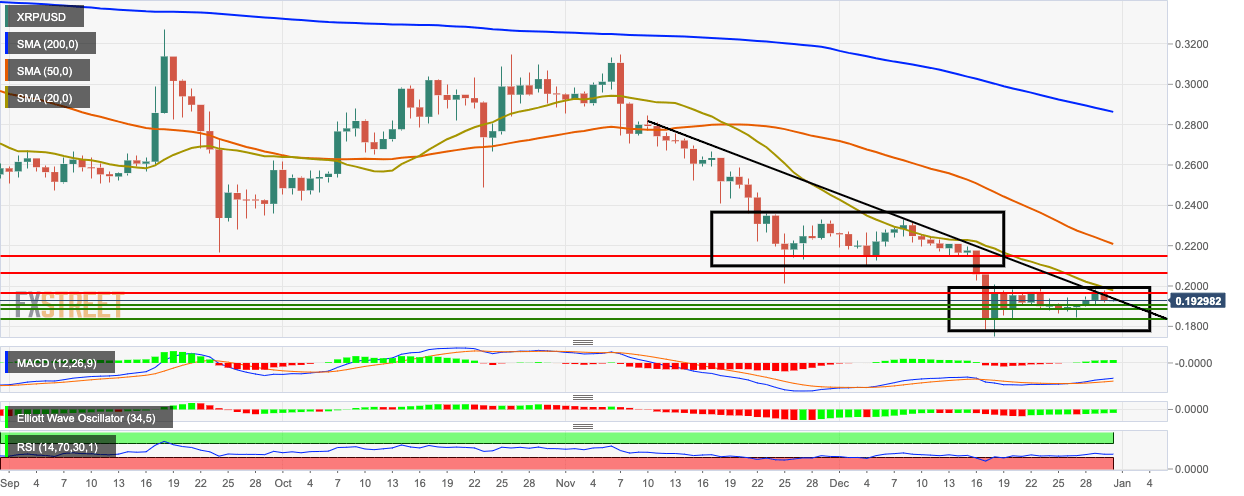
XRP/USD bulls re-entered the market in the early hours of Tuesday, following a bearish Monday, wherein it fell from $0.196 to $0.193. So far, the bulls have managed to pick up the price to $0.1931. The price is trending horizontally and is trying to break above the downward trending line. The Moving Average Convergence/Divergence (MACD) indicates decreasing bullish momentum, while the Elliott Oscillator has had four consecutive green sessions. The Relative Strength Index (RSI) indicator is hovering around 41.65, next to the oversold zone, hinting that the price can drop a bit more.
