- Ripple uptrend came close to $0.37 resistance but lost momentum leading to lower corrections towards $0.310.
- Technical indicators on the hourly XRP/USD chart send bearish signals for the short-term.
Ripple appears to have found stability above $0.30 but the upside remains limited below $0.37. The digital asset declined last week to test the major support level at $0.25 due to the selling activities that dominated the crypto market since August began. However, last week trading saw a slight bullish wave sweep across the market. XRP/USD made a tremendous recovery, first clearing the resistance at $0.30 and then trading above $0.36. The upside movement turned bearish short of $0.37.
Significantly, the trendline support stood ground marginally above $0.31 and XRP started making its way north again. The current stubborn resistance level is at $0.35. There are subtle lower corrections on the chart. XRP/USD is likely to continue correcting lower, similarly, the stochastic has changed direction downwards heading into the oversold region.
The price is, however, immediately supported by the 50 hourly simple moving average. In addition, the trendline support has been vital to the buyers since the uptrend commenced last week. Another short-term support at $0.33 will prevent declines in the vent the trendline support gives in but the stronger support lies at $0.29 – $0.30.
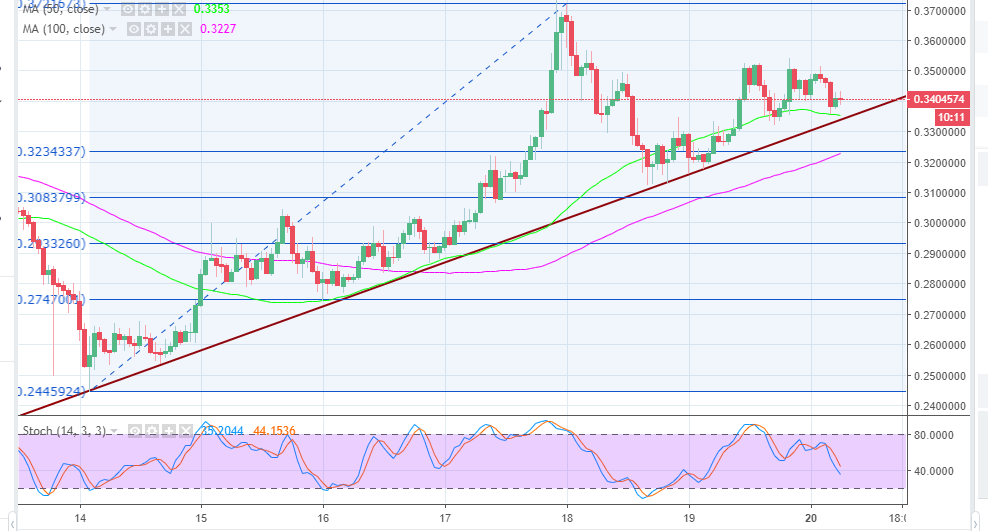
For XRP to retrace higher, the stubborn $0.35 resistance must be cleared. This will allow the bulls to gather strength to retest $0.37 resistance and later the critical $0.40. In the meantime, the support at $0.33 must not be broken. Otherwise, XRP/USD could trade towards $0.30 and the primary support at $0.25.
XRP/USD 60-minutes chart