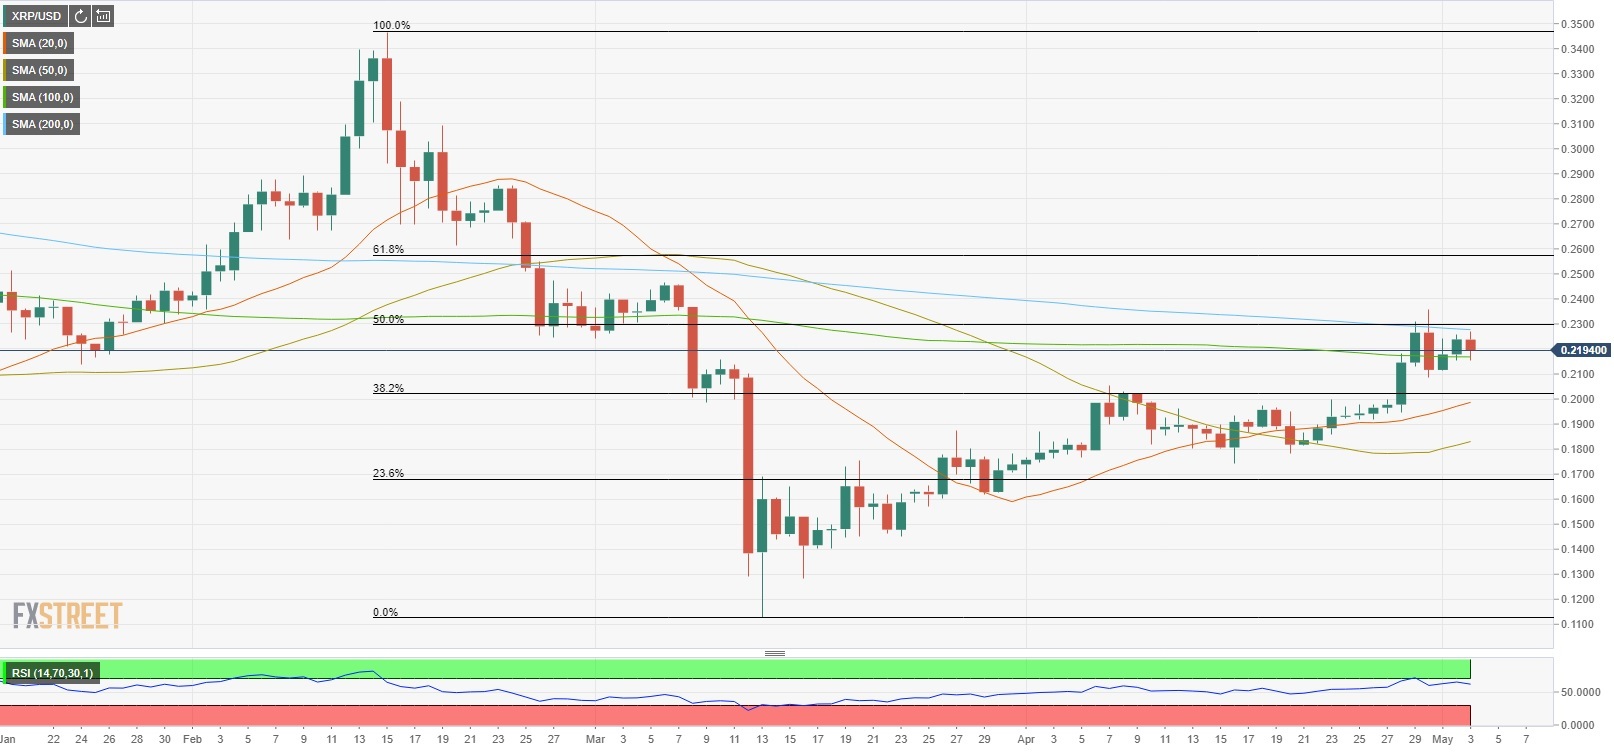
- Ripple struggles to break above 200-day SMA located near $0.23.
- Daily RSI shows bullish momentum has started to fade away.
For the fourth time this week, Ripple (XRP/USD) failed to make a daily close above the critical 200-day SMA and has gone into a consolidation phase. As of writing, the pair was trading at $0.2190, down 2.1% on a daily basis. For the week, the pair is up more than 11% and looks to post its largest weekly percentage gain since the first week of February.
Technical outlook
Although the pair seems to be struggling to rise above the resistance located at $0.23, (200-day SMA, Fibonacci %50 retracement of Feb. 15 – Mar. 13 downtrend), a strong support seems to have formed at $0.2170 (100-day SMA). As long as it doesn’t make a daily close below that support, the pair could retest $0.23 and target $0.2460 (Mar. 7 high) and $0.2500 (psychological level) afterwards.
On the other hand, $0.2085 (Apr. 30 low) aligns as an interim support below the 100-day. The main support that could determine the next long-term direction is located at $0.2000 (psychological level, Fibonacci %38.2 retracement of Feb. 15 – Mar. 13 downtrend).
XRP/USD daily chart