Ripple price opened the day on Tuesday trading in the red confirming the continued grip of the bears hands since mid-May. There was an attempt by the bulls to reclaim a crucial support at $0.60 but XRP’s recovery was hindered by the upper boundary of a descending parallel channel and the 20-day Simple Moving Average.
According to Coingape, Ripple price has lost 9.4% against the dollar over the last 24 hours. This has seen the cross-border remittances token drop to below $0.55. At the time of writing Ripple was trading in the red at $0.53.
- Are you looking to buy ripple?? Have a look at the Best Cryptocurrency Brokers guide to get started.
Ripple Price Upward Movement Barred by the 20-day SMA
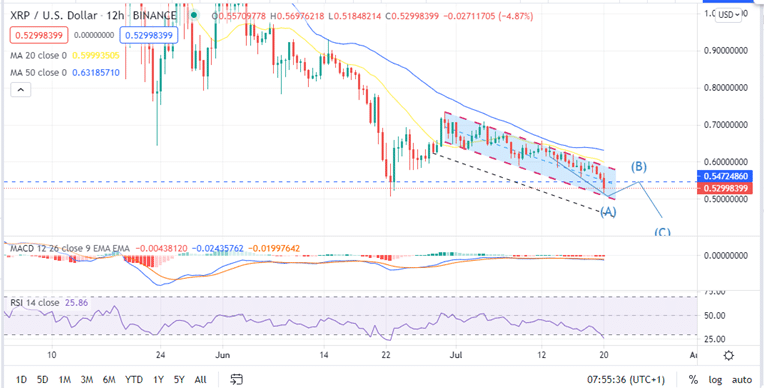
The 12-hour chart shows that XRP has been stuck below the 20-day SMA since July 8. The resistance provided by the 20-day SMA also coincides with that from the upper boundary of the descending parallel channel. This points to a downward market action as more losses become more apparent.
Note that the appearance of three black crows candlesticks over the last three trading sessions validates the bearish outlook. This suggests that Ripple bears have regained control of the market.
Moreover, the Relative Strength Index (RSI) adds credence to the current strength of the bears by its dive downwards. However, the movement of the RSI into the oversold region hint at a possible Ripple price trend reversal in the coming trading sessions.
Ripple Price (XRP/USD) 12-hour Chart
Ripple Dwindling Volumes Accentuate The Downtrend
The on-chain metrics by Santiment shows a 96% decrease in the volumes of XRP traded since April. This from a high of around 37 billion XRP on April 26 to just about 1.43 billion XRP traded on July 19. This shows the volume of transactions over the XRP network over time, highlighting whether the on-chain activity is decreasing or increasing.
![Ripple (XRP) [10.28.00, 20 Jul, 2021] Volume](https://www.forexcrunch.com/wp-content/uploads/2021/07/Ripple-XRP-10.28.00-20-Jul-2021-Volume.png)
A decrease in the volumes of an asset traded on the network is usually a bearish signal. Therefore, this metric shows that the downtrend might continue, making Ripple price recovery a daunting task.
What is Likely to Happen?
Note that if the downtrend continues, the Ripple price would be forced to find support at the $0.5 psychological level. A move past this level would see XRP re-visit the support at $0.45. An area that was last explored in March.
-Check out our guide for credible crypto signals.
On the upside, the movement of the RSI into the oversold region could mean that a trend reversal could occur in the near term. This will mean that XRP holds onto the current support level and close the day above $0.55. If this happens, Ripple could slice through the upper boundary of the descending parallel channel, overcoming the 20-day SMA resistance to levels above $0.60.
Looking to buy or trade Ripple now? Invest at eToro!
Capital at risk
