- Ripple price is bounded inside an ascending triangle pattern formed on the daily chart.
- Several indicators show the price is ready for a breakout in the short-term.
XRP price is currently at $0.253, right below a critical barrier at $0.26, which has been tested several times throughout the past two months. A breakout above this point can easily drive XRP price towards $0.30.
XRP bulls need to crack $0.26 for good
XRP price has pierced through the critical resistance level at $0.26 several times in the past but never managed to close above it. The 100-SMA on the daily chart is also established at $0.26, adding even more strength to the level.
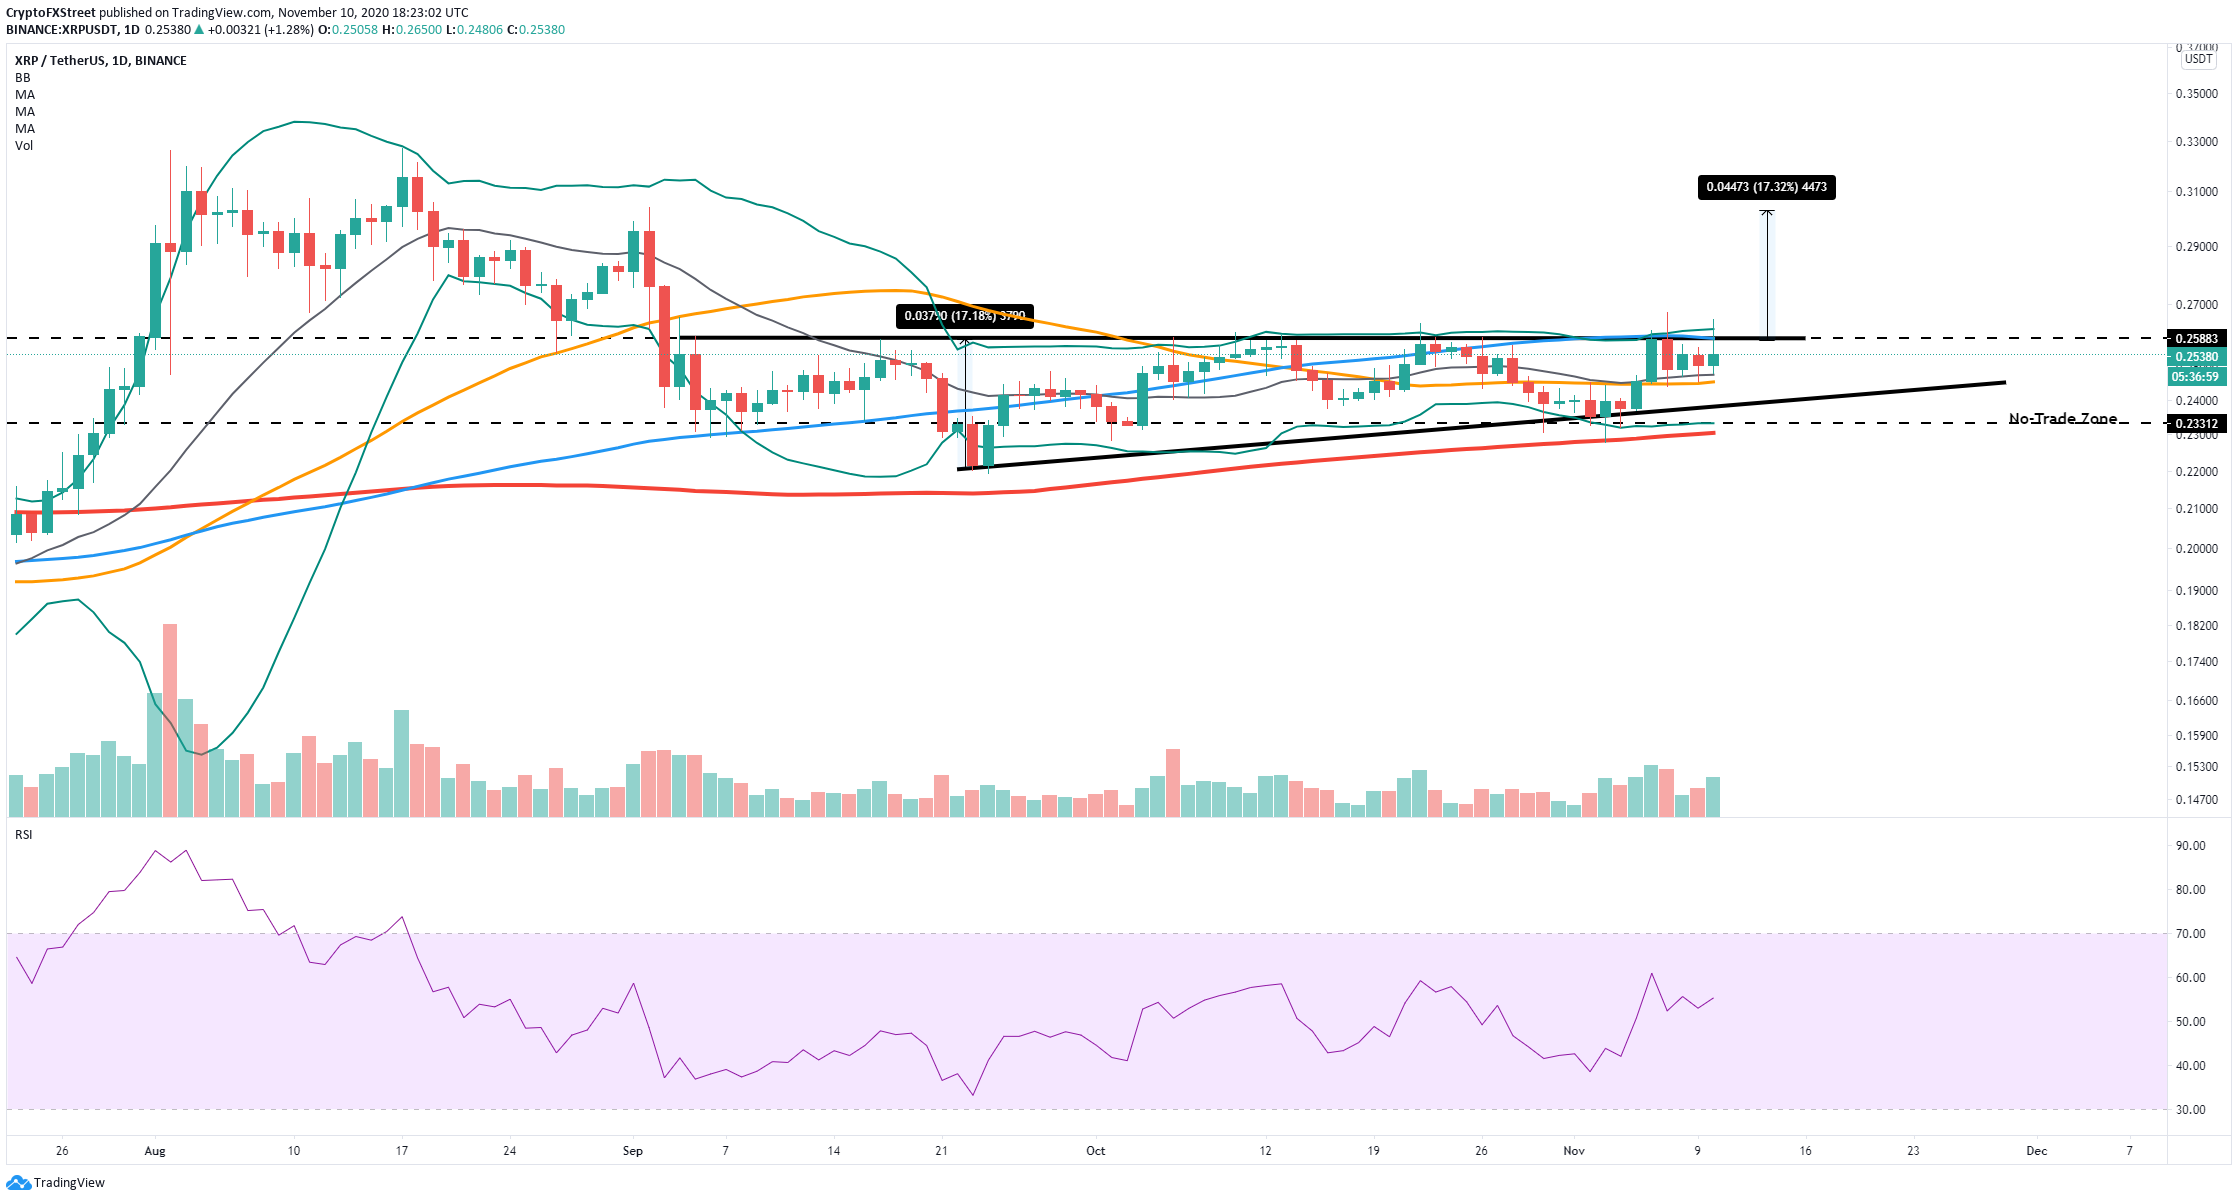
XRP/USD daily chart
Additionally, the Bollinger Bands are squeezing significantly after a period of stagnation. The upper Band coincides with the 100-SMA and the upper boundary of the ascending triangle pattern on the daily chart. A breakout above this critical point can quickly drive XRP price towards $0.30.
%20%5B19.23.52,%2010%20Nov,%202020%5D-637406298116543676.png)
XRP Holders Distribution chart
The Holders Distribution chart shows a notable increase in the number of holders with at least 10,000,000 XRP coins from a low of 304 on November 2 to 310 currently. This growth of whales signifies a developing interest in the digital asset despite the current flat price action.
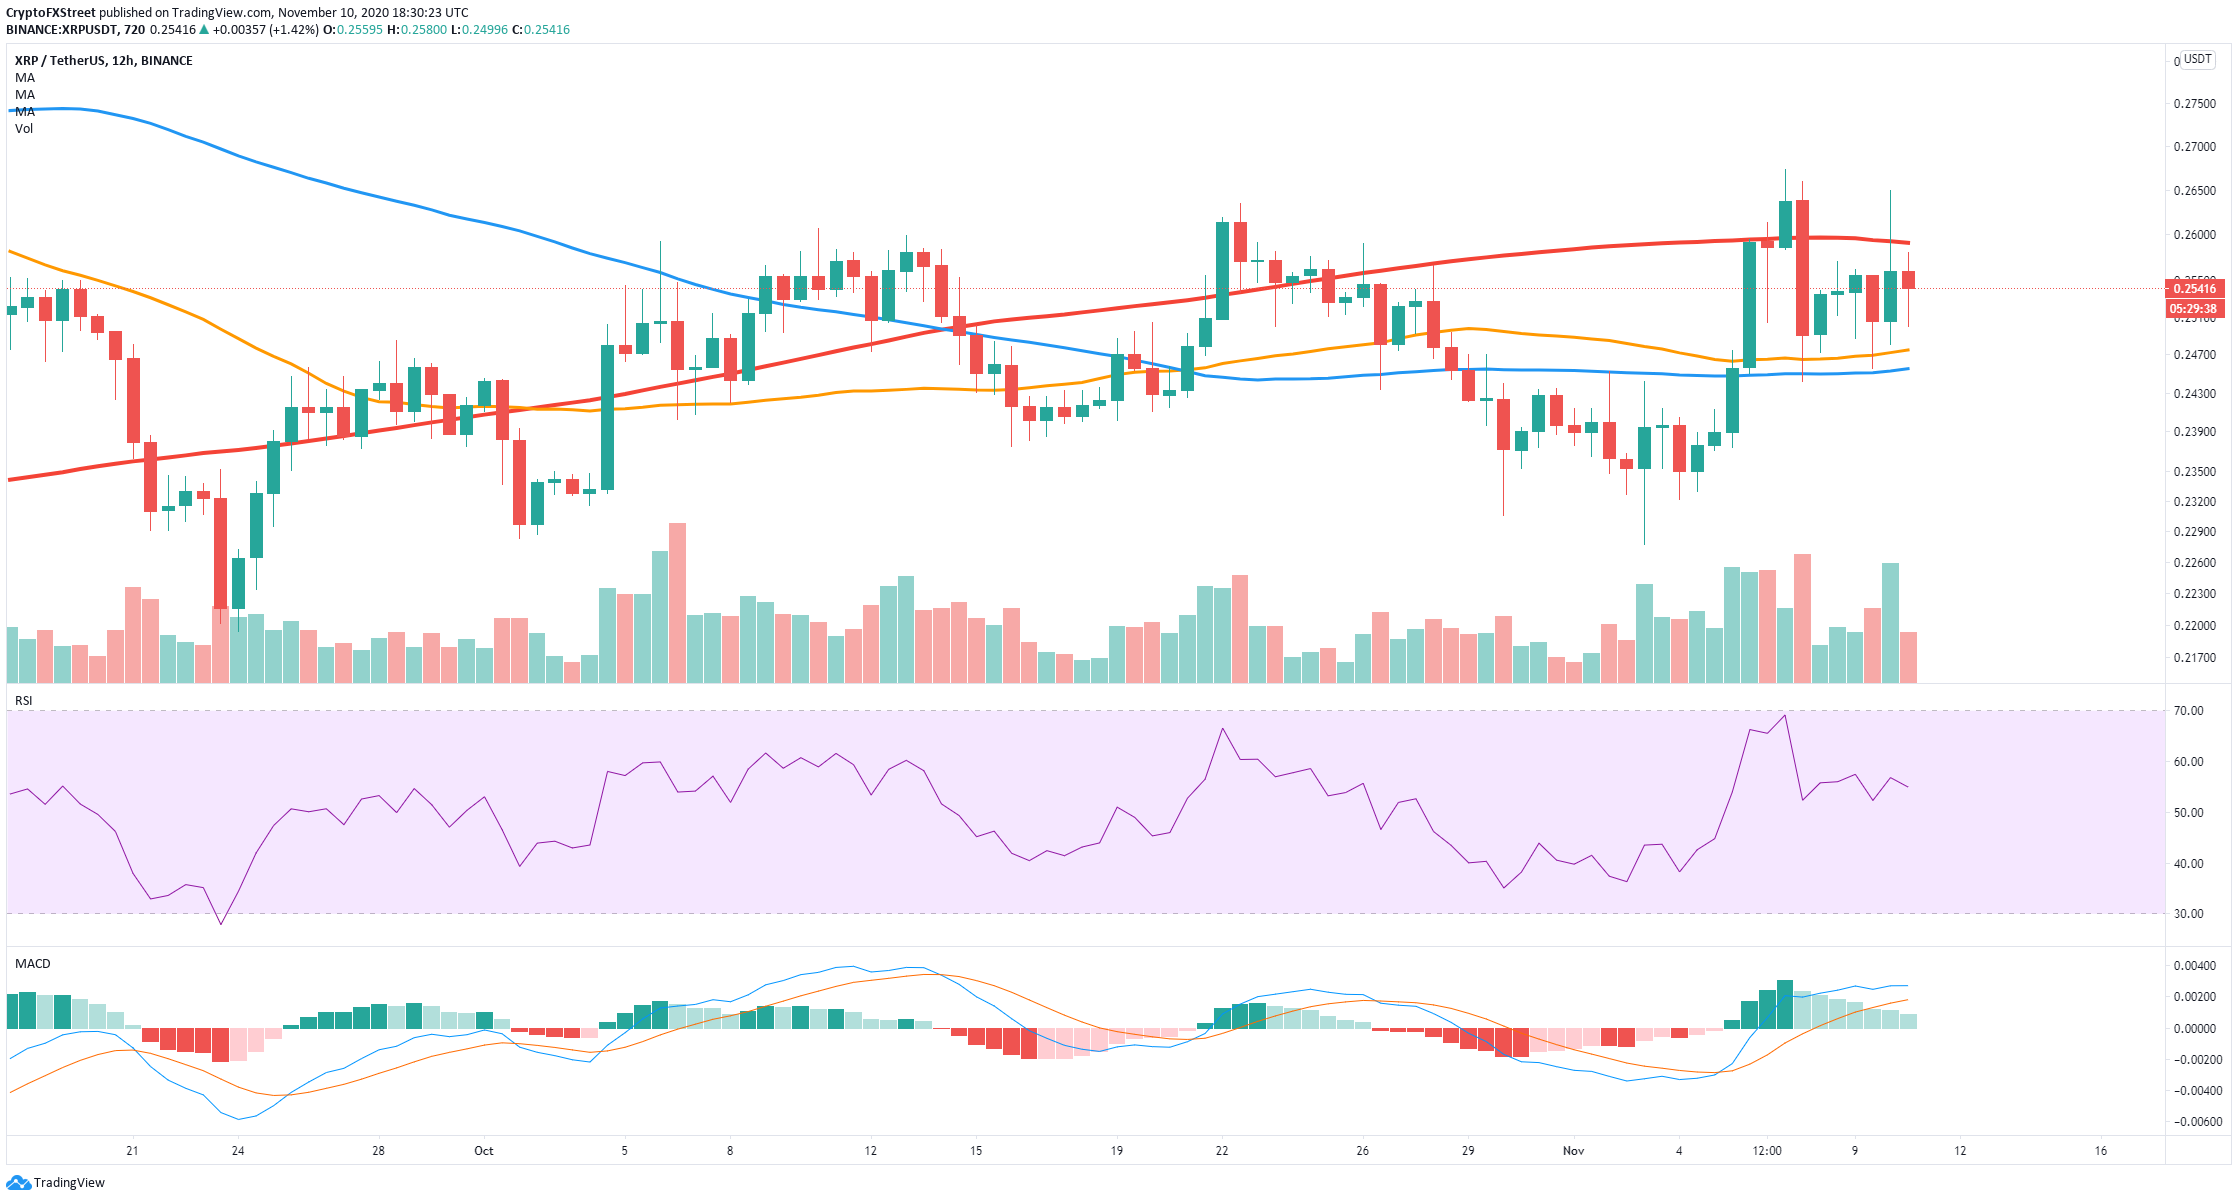
XRP/USD 12-hour chart
Despite the bullish metrics, XRP price got rejected from $0.26 again. On the 12-hour chart, the 200-SMA also coincides with the same level adding even more strength to it. The closest bearish price target following this rejection is $0.247, which is the 50-SMA on the 12-hour chart and also on the daily chart.
