- XRP/USD stays below the key barrier created by a trendline.
- A sustainable move above $0.2860 will create a strong upside momentum.
Ripple’s XRP has been range-bound with bearish bias recently. The third digital asset with the current market value of $11.9 billion retreated to the area below $0.2800 after a failed attempt to break above the long-term sloping trend line (currently at $0.2810). At the time of writing, XRP/USD is changing hands at $0.2770, down 1.4% from this time on Wednesday and unchanged on a day-on-day basis.
Ripple’s XRP confluence levels
Looking technically, a strong resistance created by the trendline may lin=mit the recovery and push the price inside of the triangle. In this case, the coin will continue moving with a bearish bias towards the lower line of the said triangle pattern (currently at $0.2560) Let’s have a closer look at the technical levels that may serve as resistance and support areas for the coin.
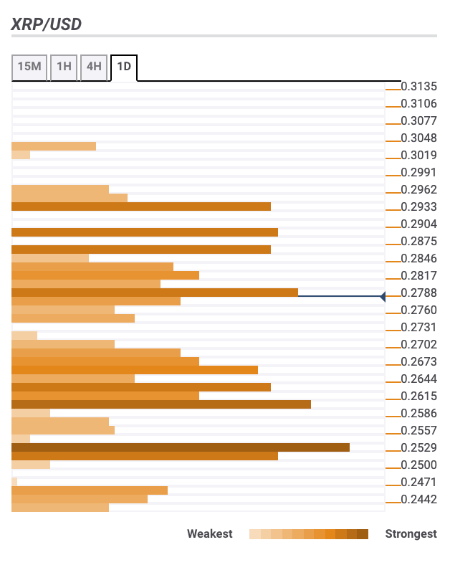
Resistance levels
$0,2860 – 61.8% Fibo retracement monthly, 23.6 Fibo retracement daily, the long-term trendline;
$0,2900 – Pivot Point one-day Resistance 1, the upper line of four-hour Bollinger Band, SMA100 (Simple Moving Average) daily, Pivot Point one-week Resistance 3;
$0,3000 – psychological level, the upper line of one-day Bollinger Band.
Support levels
$0,2630 – 161.8% Fibo projection, the highest level of the previous week, Pivot Point one-week Resistance 1, SMA200 four-hour;
$0,2530 – the lowest level of the previous year, 38.2% Fibo retracement weekly;
$0.2450 – 61.8% Fibo retracement weekly.