- XRP/USD bulls have lost initiative was the price breaks below $0.2700.
- The coin may extend the downside correction to $0.2500.
Ripple’s XRP extended thee sell-off to $0.2633 on Thursday. The coin is moving in sync with the market, controlled by bearish sentiments. A sustainable move below $0.2700 support bodes ill for XRP’s short-term forecast, making it vulnerable to further losses.
Read also: Ripple price analysis: How far can this lethargic range-bound trading go?
Ripple’s XRP confluence levels
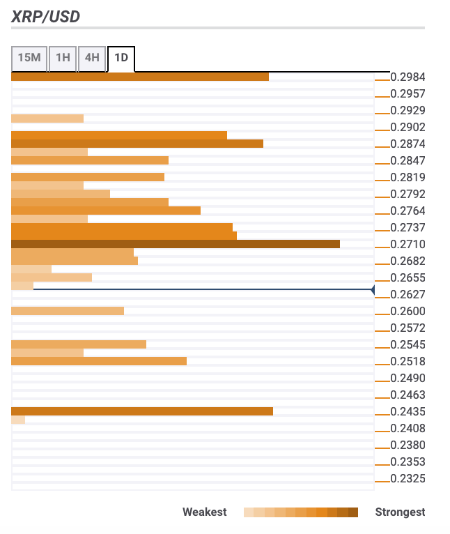
Looking technically, $0.27 has turned into a key resistance level for XRP/USD. The longer, the coin stays below this barrier, the worse is the technical picture. Currently, there are several barriers clustered both above and below the price; though the way to the South seems to be the path of least resistance now.
Let’s have a closer look at the technical levels that may serve as resistance and support areas for the coin.
Resistance levels
$0.2700 – the lower line of 4-hour Bollinger Band, the lower line of the daily Bollinger Band, 61.8% Fibo retracement monthly, SMA10 (Simple Moving Average) 1-hour
$0.2770 – SMA100 (Simple Moving Average) on a daily chart, the upper line of 1-hour Bollinger Band, the highest level of the previous day
$0.2900 – 38.2% Fibo retracement monthly
Support levels
$0.2600 – Pivot Point 1-week Support 1
$0.2510 – the lowest level of the previous year
$0.2430 – the lowest level of the previous month, Pivot Point 1-week Support 2.