- XRP/USD recovery loses traction on approach to $0.2200.
- The coin may resume the downside if the resistance is not broken.
Ripple’s XRP hovers around $0.22 during early Asian hours, off the intraday high of $0.2223. The third-largest digital coin has gained over 4% on a day-to-day basis amid global recovery on the cryptocurrency market; however, the further upside may be limited
Read also: Ripple completed a $ 50 million deal with MoneyGram
Ripple’s XRP confluence levels
Looking technically, XRP’s short-term recovery is capped by SMA50 (Simple Moving Average)50 1-hour, located above $0.22. The longer the coin hovers around this barrier, the more the chance that the coin will resume the sell-off. Currently, there are several essential levels clustered both above and below the price.
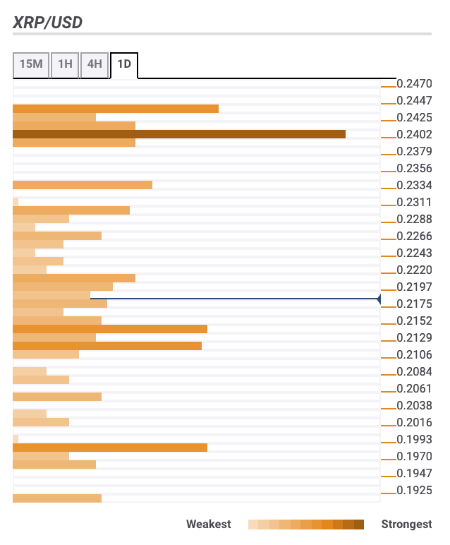
Let’s have a closer look at the technical levels that may serve as resistance and support areas for the coin.
Resistance levels
$0.2200 – the middle line of 1-hour Bollinger Band, SMA50 1-hour
$0.2300 – 23.6% Fibo retracement weekly
$0.2400 – 38.2% Fibo retracement weekly, Pivot Point 1-day resistance 2, the upper line of 4-hour Bollinger Band, SMA50 4-hour, SMA100 1-hour
Support levels
$0.2150 – Pivot Point 1-day Support 1, the lower line of the daily Bollinger Band
$0.2100 – 38.2% Fibo retracement daily, Pivot Point 1-month Support 2, the lower line of 4-hour Bollinger Band
$0.2000 – the lowest level of the previous day.