- Ripple’s coin may continue moving down in sync with the market.
- XRP/USD recovery capped by daily SMA 100.
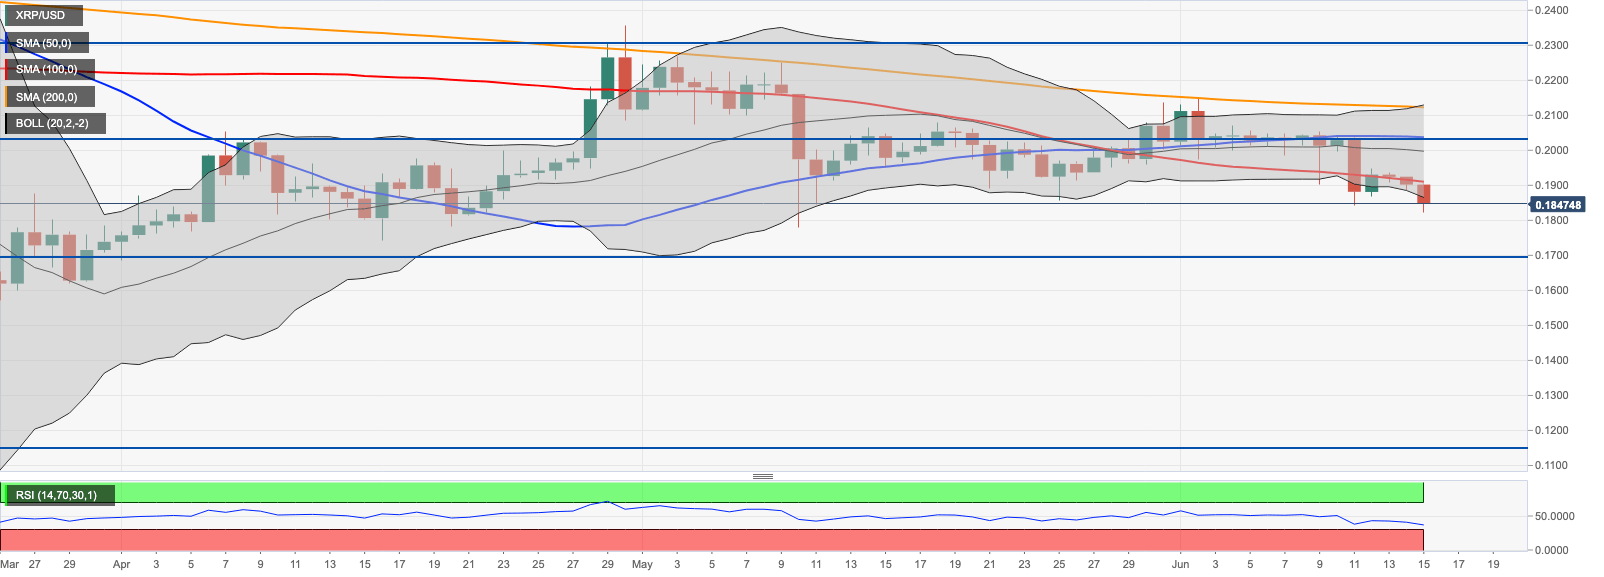
Ripple’s XRP is changing hands at $0.1844 down over 3% both on a day-to-day basis and since the beginning of the day. The four-largest didital asset with the current market capitalization of $8.2 billion and an average daily trading volume of $1.1 billion extended the decline after a period of range-bound trading during the weekends.
XRP/USD: technical picture
XRP/USD broke below $0.1900 and extended the decline under the lower line of the daily Bollinger Band at $0.1860 during early Asian hours. The coin hit the intraday low at $0.1822 and recovered to $0.1845 by press time; however, the short-term bias remain bearish.
On the upside, the key resistance is created by the above-mentioned $0.1900. This psychological barrier is reinforced by daily SMA100 at $0.1910 that has been limiting the recovery since June 12. Once it is out of the way, the upside is likely to gain traction with the next focus on $0.2000. However, a stronger barrier comes at $0.2030 as it is created by a combination of strong technical factors, including daily SMA50, 38.2% Fibo retracement for the downside move from February 2020 high and an upper boundary of the previous consolidation channel.
On the downside the price is supported by $01820-0.1800 area. If it is cleared, the sell-off will gather pace and push the price towards $0.1700 (23.6% Fibo retracement for the downside move from February 2020 high) where a fresh buying interest is likely to absorb the selling pressure.
XRP/USD daily chart