- XRP needs to break $0.2136 convincingly to maintain the uptrend.
- A clear bull break at $0.2080 was cut off short after peaking at $0.2136 and dropping down to $0.2000 on the same day.
- The low of the rejection is set at $0.2002 and can serve as support for XRP buyers.
XRP/USD daily chart
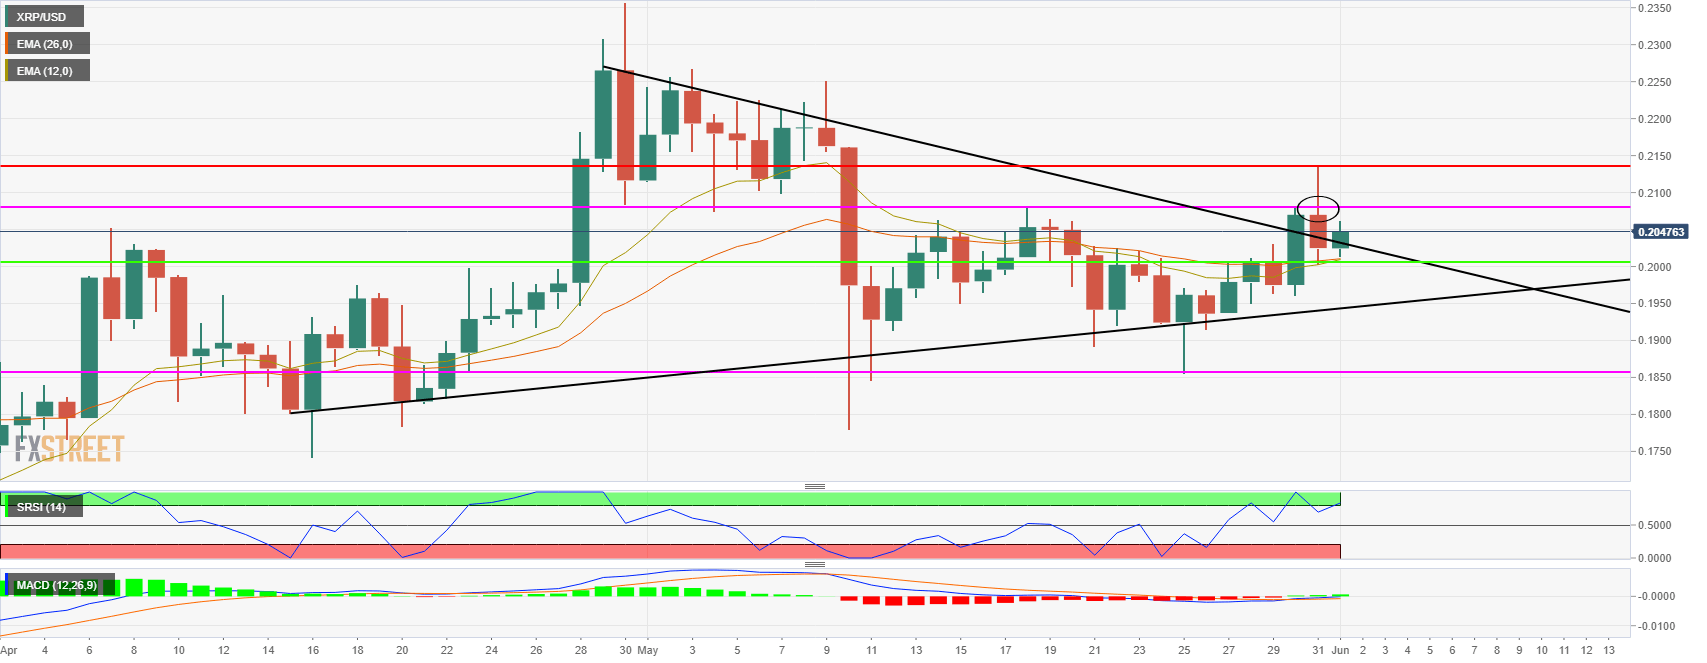
After a botched bull break above the top pink resistance line on Sunday, XRP/USD has dropped down to the green support line at $0.2002. That attempt was also a break above the symmetrical triangle formed on the daily chart, but unfortunately, XRP buyers got rejected significantly.
Daily EMAs are now on the verge of a bear cross, while the MACD has crossed bullishly around two days ago. The $0.2136 resistance point and $0.2080, which is the last level the bulls managed to break, are the most critical resistance levels. Support can be found at $0.2002 as the last high of the move downwards after the rejection.
XRP/USD technical levels
