- The four-hour chart has peeked above the 20-day Bollinger band.
- XRP/USD spiked from $0.293 to $0.2998 in just one hour.
XRP/USD daily chart
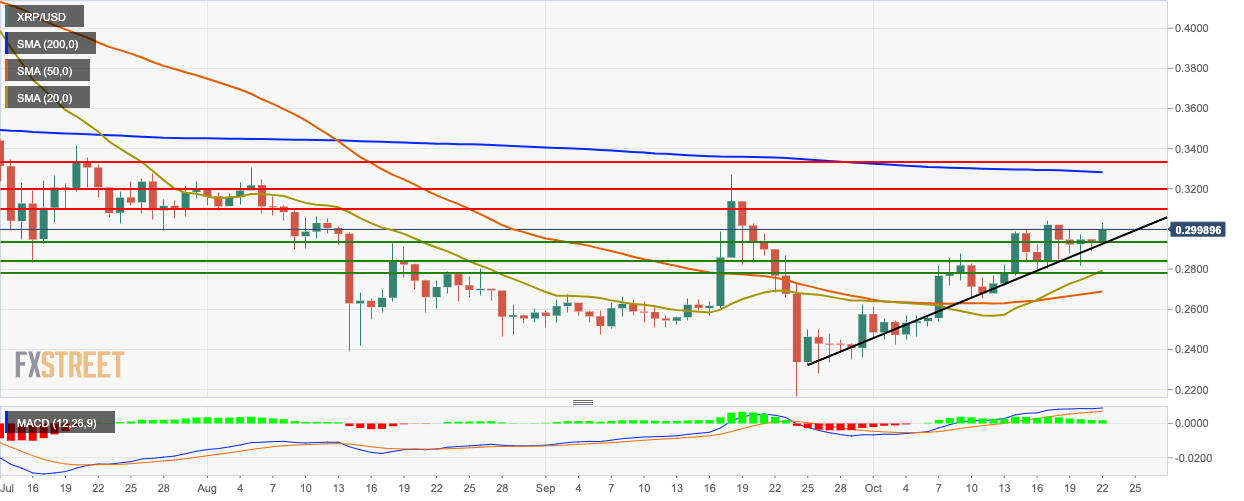
XRP/USD has gone up from $0.293 to $0.298 so far today. The market has found support on the upward trending line. The bulls will need to break past the resistance provided by the $0.302 level to continue its upward momentum. The Moving Average Convergence/Divergence (MACD) indicates sustained, yet decreasing bullish momentum.
XRP/USD four-hour chart
-637073133004058869.png)
The four-hour XRP/USD chart has peeked above the 20-day Bollinger band, which indicates that the price is overvalued and may face correction soon. Along with the upward trending line, the price has also found support on the 20-day Simple Moving Average (SMA 20) and SMA 50 curves. The Elliott Oscillator has had a significant spike in its latest session, going up from 0 to 0.0016.
XRP/USD hourly chart
-637073133297034166.png)
The hourly XRP/USD chart has spiked up from the green Ichimoku cloud, going up from $0.293 to $0.2998 in just one hour. The Relative Strength Index (RSI) indicator jumped into the overbought zone before dipping down to 65.62.
Key Levels
