Home Ripple  Technical  Analysis: XRP/USD bulls finally break stubborn descending trend line leaping 5%, however stopped short heading into $0.47
Crypto News

Ripple  Technical  Analysis: XRP/USD bulls finally break stubborn descending trend line leaping 5%, however stopped short heading into $0.47

  • Ripple managed to breakout to the upside from a  descending  trend line, that had been containing the price since 3rd July.  
  • XRP/USD further upside was stopped by touted resistance ahead of $0.4700.  


XRP/USD 60-minute chart
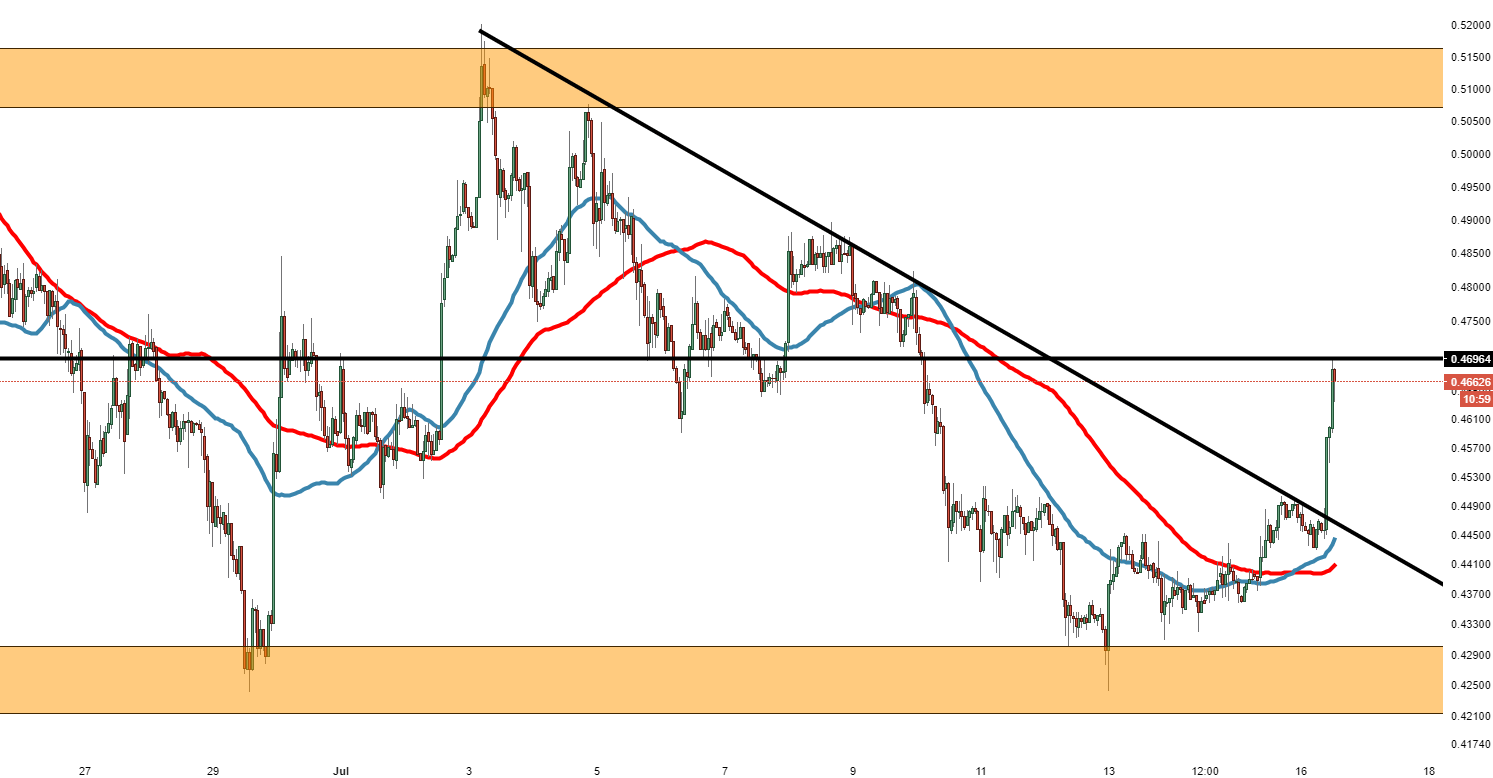


Spot rate:                                     0.46500

Relative change:               +3.85%

High:                                                   0.46969

Low:                                                      0.44286


Trend:                                                 Bullish


Support 1:                                  0.46411, 7th July low.  

Support 2:                                      0.45908, 6th July low & (support on 60-minute chart).

Support 3:                    0.45000, demand zone.

Resistance  1:               0.46969, today’s (Monday) high.  

Resistance 2:               0.48000, (resistance on 60-minute chart).

Resistance 3:               0.48201, 9th July high.


FX Street

FX Street

FXStreet is the leading independent portal dedicated to the Foreign Exchange (Forex) market. It was launched in 2000 and the portal has always been proud of their unyielding commitment to provide objective and unbiased information, to enable their users to take better and more confident decisions.