- XRP/USD dropped from $0.197 to $0.19 this Monday.
- The MACD indicator is reversing market momentum from bearish to bullish.
XRP/USD daily chart
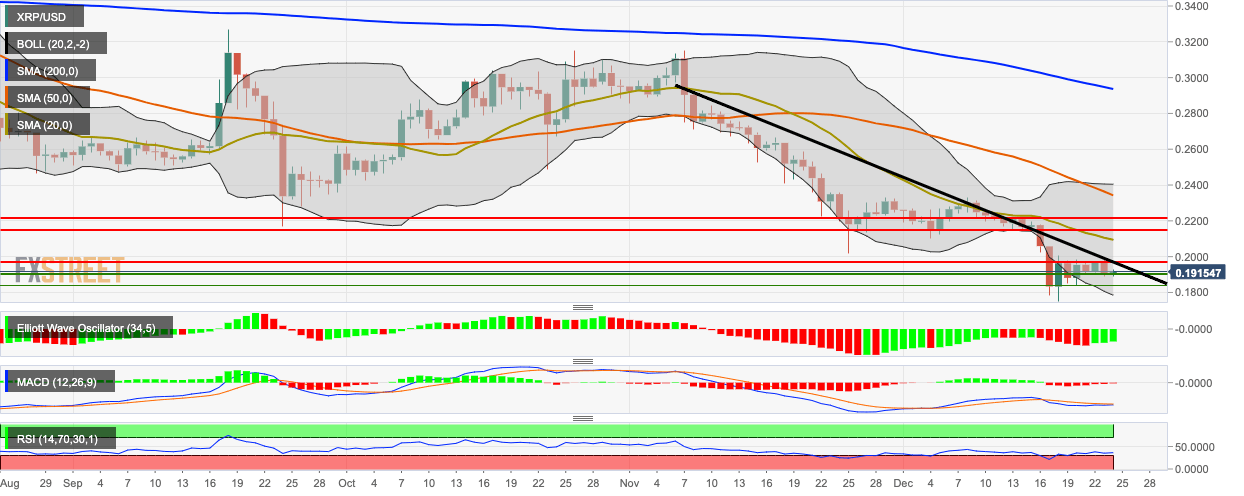
XRP/USD bulls have re-entered the market as the price went up slightly from $0.19 to $0.191 this Tuesday. This follows a bearish Monday, wherein the price dropped from $0.197 to $0.19. The price is hovering below the 200-day Simple Moving Average (SMA 200), SMA 50 and SMA 20 curves and trending in the lower half of the 20-day Bollinger Band. The Elliott Oscillator has had three straight green sessions, while the Moving Average Convergence/Divergence (MACD) indicates that the market momentum will potentially reverse from bearish to bullish.
