- XRP/USD makes a technical correction on Wednesday following three straight days with losses, stays dangerously close to 2018 lows.
- On the daily chart, the descending linear regression channel’s mid-line acts as a short-term support.
XRP/USD daily chart
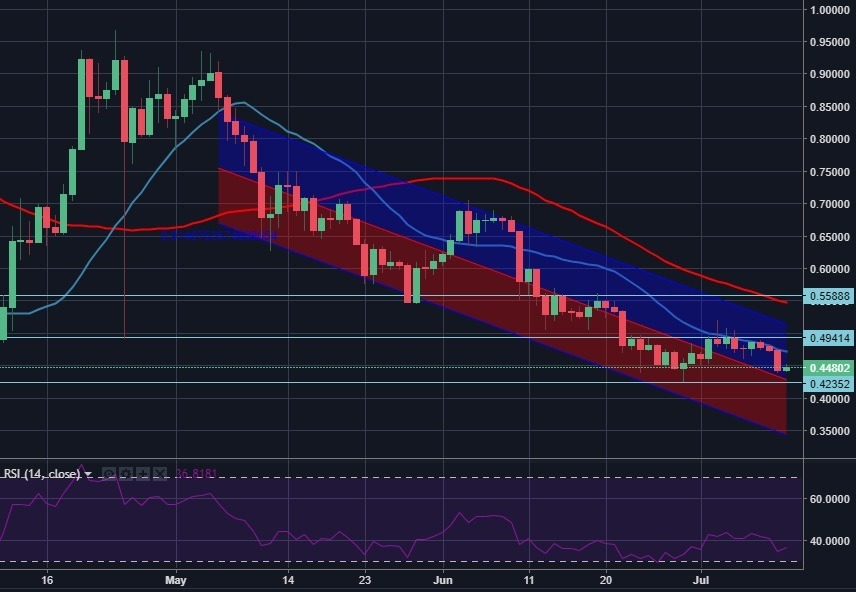
Spot rate: 0.4486
Relative change: +1.33%
High: 0.4516
Low: 0.4390
Trend: Bearish
Support 1: 0.4240 (Jun. 29 low/2018 low).
Support 2: 0.3500 (bottom line of the daily linear regression channel).
Support 3: 0.3000 (psychological level).
Resistance 1: 0.4715 (20-DMA).
Resistance 2: 0.5000 (psychological level/horizontal resistance).
Resistance 3: 0.5475 (50-DMA).
