- XRP/USD went down from $0.256 to $0.255 in the early hours of Saturday.
- The SMA 20 curve acts as immediate market support.
XRP/USD daily chart
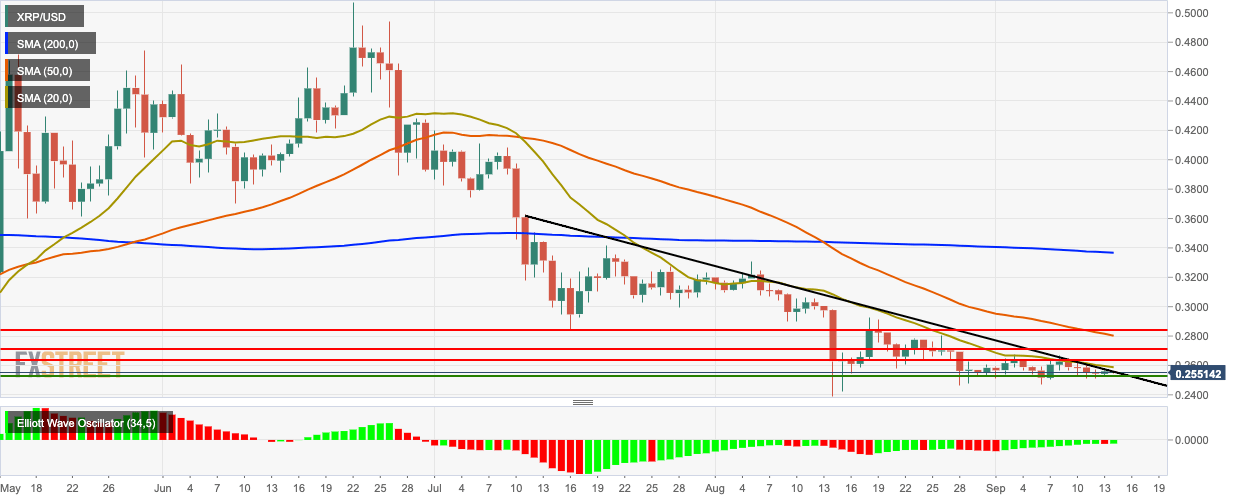
XRP/USD has been trending horizontally between $0.263 – $0.252 for the last two weeks. The price has gone down from $0.256 to $0.255 in the early hours of Saturday. The market has found resistance on the downward trending line and is below the 200-day simple moving average (SMA 200) and SMA 50 curves. SMA 20 curve acts as immediate market support. The Elliott oscillator had a bearish session after 11 straight bullish sessions. However, the Elliott oscillator went back to being bullish.
XRP/USD 4-hour chart
-637040336483743839.png)
The 4-hour market is trending in a triangle formation. The price is sandwiched between the SMA 50 and SMA 20 curves. The SMA 20 acts as support, while SMA 50 acts as resistance. The 20-day Bollinger jaw has constricted, which indicates decreasing market volatility. The moving average convergence/divergence (MACD) indicator shows six straight bullish sessions of increasing intensity.
XRP/USD hourly chart
-637040336120614468.png)
The hourly market has found support on the upward trending line and is trending below the red Ichimoku cloud. The relative strength index (RSI) indicator is trending around the neutral zone.
Key Levels
