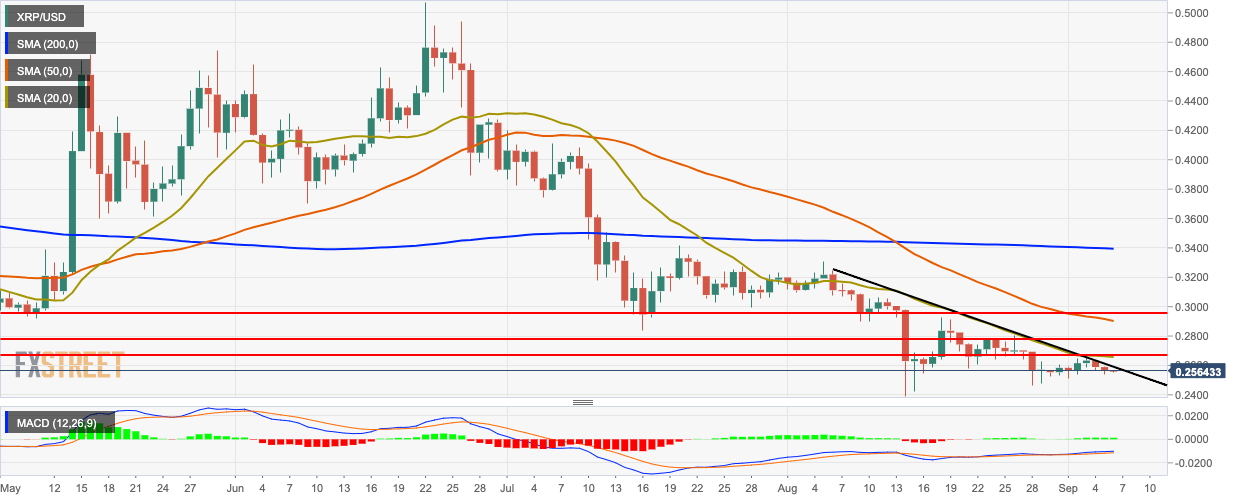
XRP/USD is currently priced at $0.256 in the early hours of Friday. Over the last three days, XRP/USD has gone down from $0.263 to $0.256. XRP/USD daily chart The daily price chart shows us that XRP/USD is on the course of having a third straight bearish day. The price has gone down from $0.263 to $0.256 over the last three days. The price has been checked by the downward trending line and is below the 200-day simple moving average (SMA 200), SMA 50 and SMA 20 curves. The moving average convergence/divergence (MACD) indicator shows sustained bullish sentiment. XRP/USD 4-hour chart The 4-hour price chart is trending below the green Ichimoku cloud. It is also trending below the SMA 200, SMA 50 and SMA 20 curves. The price has found support on the $0.254 line and needs to overcome resistance at the $0.258. The Elliott oscillator shows 12 straight bearish sessions. XRP/USD hourly chart The hourly chart shows that the latest session was bullish enough to break above the resistance provided by the SMA 20 curve. The 20-day Bollinger jaw is constricting, indicating decreasing market volatility. The relative strength index (RSI) indicator is trending around 50. Key Levels FX Street FX Street FXStreet is the leading independent portal dedicated to the Foreign Exchange (Forex) market. It was launched in 2000 and the portal has always been proud of their unyielding commitment to provide objective and unbiased information, to enable their users to take better and more confident decisions. View All Post By FX Street Crypto News share Read Next Germany: China talks in focus today – Rabobank FX Street 4 years XRP/USD is currently priced at $0.256 in the early hours of Friday. Over the last three days, XRP/USD has gone down from $0.263 to $0.256. XRP/USD daily chart The daily price chart shows us that XRP/USD is on the course of having a third straight bearish day. The price has gone down from $0.263 to $0.256 over the last three days. The price has been checked by the downward trending line and is below the 200-day simple moving average (SMA 200), SMA 50 and SMA 20 curves. The moving average convergence/divergence (MACD) indicator shows sustained bullish sentiment. XRP/USD 4-hour chart… Regulated Forex Brokers All Brokers Sponsored Brokers Broker Benefits Min Deposit Score Visit Broker 1 $100T&Cs Apply 0% Commission and No stamp DutyRegulated by US,UK & International StockCopy Successfull Traders 9.8 Visit Site FreeBets Reviews$100Your capital is at risk. 2 T&Cs Apply 9.8 Visit Site FreeBets Reviews$100Your capital is at risk. 3 Recommended Broker $100T&Cs Apply No deposit or withdrawal feesTrade major forex pairs such as EUR/USD with leverage up to 30:1 and tight spreads of 0.9 pips Low $100 minimum deposit to open a trading account 9 Visit Site FreeBets ReviewsYour capital is at risk. 4 T&Cs Apply Visit Site FreeBets ReviewsYour capital is at risk. 5 Recommended Broker $0T&Cs Apply Trade gold, silver, and platinum directly against major currenciesUp to 1:500 leverage for forex trading24/5 customer service by phone and email 9 Visit Site FreeBets ReviewsYour capital is at risk.