- Ripple price in the latter stages of Wednesday was seen down just over 0.5%.
- Price action on the 60-minute chart view is pointing to some further near-term downside.
- XRP/USD was trading within an ascending wedge pattern, this breached in the session.
- The price has since retested underneath the breached wedge, which points to further potential downside.
XRP/USD 60-minute chart
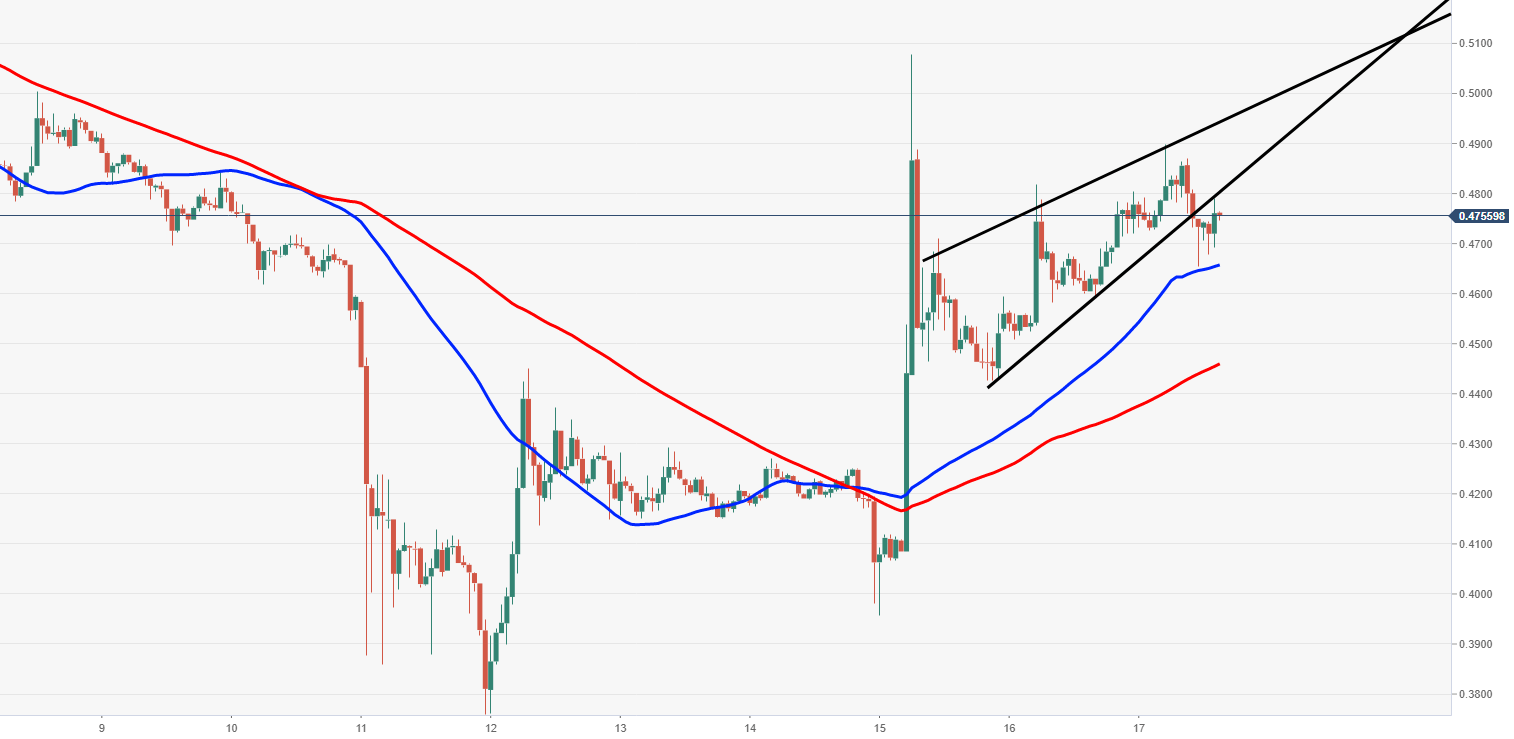
Spot rate: 0.47540
Relative change: -0.55%
High: 0.49750
Low: 0.47139
Trend: Bearish
Support 1: 0.46950, support on 60-minute chart.
Support 2: 0.46550, 50MA (60-minute)..
Support 3: 0.44600, 100MA (60-minute).
Resistance 1: 0.48050, underneath breached wedge.
Resistance 2: 0.49250, 50MA (4-hour).
Resistance 3: 0.50000, psychological resistance.
